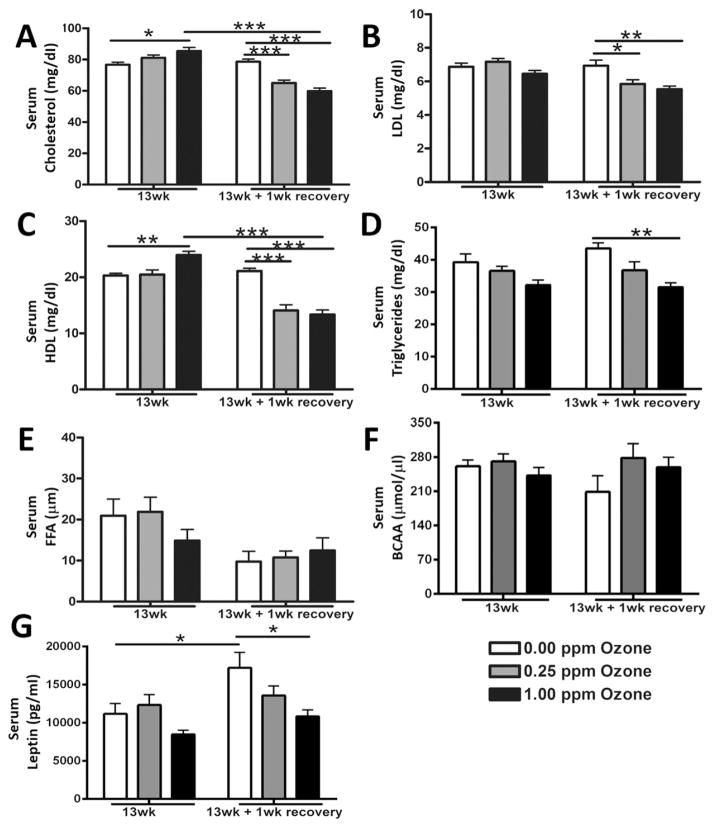
Fig. 7.
Subchronic ozone-induced changes in serum metabolic markers. Changes in circulating metabolites and leptin were measured in rats exposed to air, 0.25 ppm, or 1.00 pm ozone at 13 wk and after 1wk recovery. The biomarkers included (A) total cholesterol, (B) low density lipoprotein (LDL), (C) high density lipoprotein (HDL), (D) triglycerides, (E) non-esterified fatty acids (NEFAs), (F) branched chain amino acids (BCAA) and (G) leptin. Values indicate mean ± SEM (n = 8–10). *Indicates differences between groups (*p < 0.05, **p < 0.01, ***p < 0.001).

