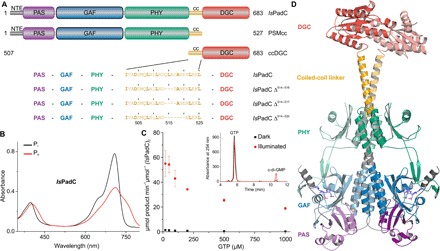
Fig. 1. Overview of IsPadC.

(A) Schematic representation of IsPadC constructs characterized in this study. Individual domains are colored in dark gray, violet, blue, green, orange, and red for the N-terminal extension (NTE), Per-ARNT-Sim (PAS), cGMP phosphodiesterase–adenylyl cyclase–FhlA (GAF), phytochrome-associated (PHY), coiled-coil (cc), and DGC domains, respectively. Coiled-coil truncations are denoted as, for example, IsPadC Δ514–520 for the variant deleted in one heptad including residues 514 to 520. (B) Spectral characteristics of dark-adapted (Pr state) IsPadC in comparison to the Pfr state obtained after red light illumination. (C) Kinetic characterization of GTP to c-di-GMP conversion. The characteristic GTP concentration dependence of initial rates of c-di-GMP formation is indicative of substrate inhibition, which is observed for both light- and dark-state activities. Product formation was quantified in triplicate for several reaction times, and the SD of individual points contributed to the error estimation of the linear fit that is used to calculate the initial rate of product formation. The SE of the estimate from the linear regression is shown as an error bar for each GTP concentration. The inset shows representative traces of the high-performance liquid chromatography (HPLC) assay used for quantifying product formation. (D) Overall structure of IsPadC with individual domains in cartoon representation colored according to (A), with one protomer highlighted in pale colors. The biliverdin cofactor, in slate color, and its attachment site Cys17 from the NTE are shown as stick models.
