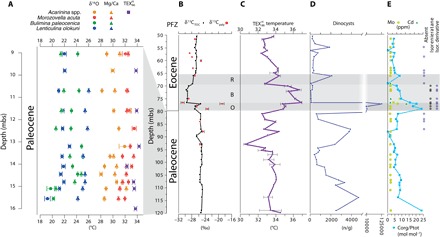
Fig. 1. Temperature and environment for the SQ (A) and IB10B core (B to E).

(A) SQ surface and bottom-water temperature reconstructions based on Mg/Ca (triangles), δ18O (circles) of selected foraminifer species, and (squares). Error bars represent analytical errors. Conservative 1σ calibration errors: 1.6°C for δ18O; 1.7° and 2°C for planktonic and benthic Mg/Ca, respectively; and 2.5°C for . (B) IB10B stable carbon isotope record of TOC (δ13CTOC) and palynological residue (δ13Cpaly). The phases of the CIE are denoted by O, B, and R for onset, body, and recovery, respectively. PFZ, planktonic foraminifer zone. (C) -based SST (error bars based on replicate measurements). (D) Absolute concentrations of dinocysts per gram of dry sediment. Note the scale break between 4,000 and 10,000. (E) Indicators of anoxia: Organic carbon over total phosphorus ratio (Corg/Ptot) (blue squares). Presence of isorenieratene and its derivative. Concentrations of redox-sensitive trace elements Mo (light green circles) and Cd (dark green triangles) in parts per million (ppm). Note that Mo concentrations are close to the detection limit, and absolute values should be treated with caution.
