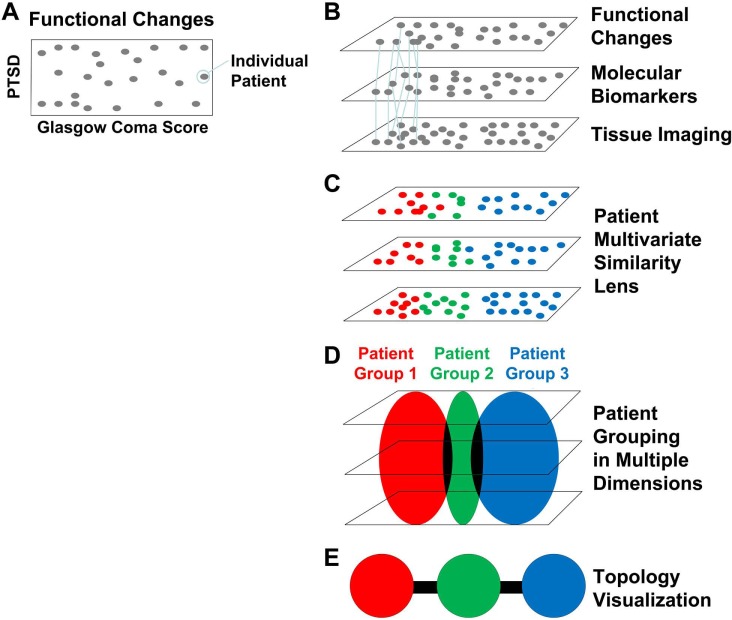
Fig 1.
(A-E). Methodological work-flow for integrating diverse clinical TBI data. (A) Hypothetical example of a spatial bi-plot of individual patients (grey points) on 2 functional endpoints after TBI (GOS-E AND PTSD). The same approach can be applied to multiple metrics simultaneously using multivariate pattern detectors (e.g., principal component analysis) to produce a multivariate view of function. (B) In TRACK-TBI Pilot the same individuals (N = 586) were tracked prospectively across multiple domains (function, biomarkers, imaging) providing connections (lines) across domains to improve patient classification using the full syndromic space. (C) Multivariate pattern detection lens can be used to categorize (colors) patients across all domains. (D) Patient grouping by multivariate lens. (E) Topological visualization renders patient groups into individual nodes, colored by the multivariate lens. Edges (black lines) indicate individuals appearing in both groups producing a syndromic map of patient clusters.

