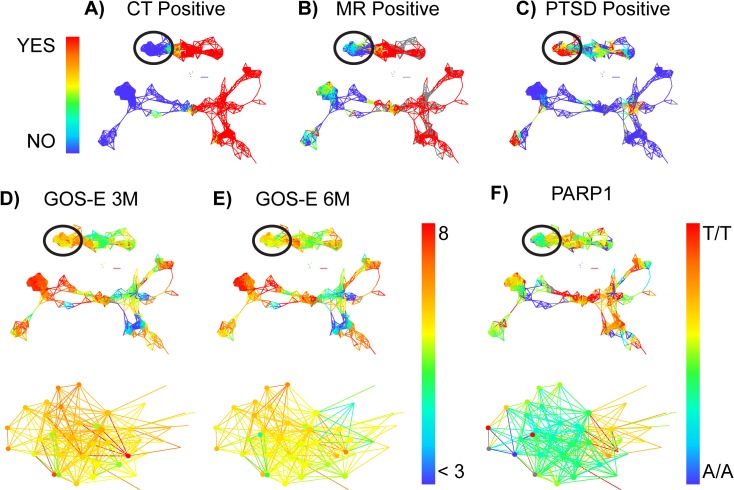
Fig 2.
(A-F). TBI CDE network topology identifies the PARP1 SNP as a candidate predictor of GOS-E deficits in mild TBI. Patients with TBI were mapped into a TDA network, highlighting color schemes for CT (A) and MRI (B) pathology and whether they had a confirmed diagnosis of PTSD (DSM IV) at 6 months post-TBI (C). Patients in the circled regions of the network were identified due to substantial dysfunction measured by the GOS-E both at 3 months (D) and 6 months (E) post-TBI, compared with other patients in the network with no CT pathology and no diagnosis of PTSD. Data-driven exploration of these patients in the network revealed a significant categorical enrichment for the PARP1 SNP (F), particularly the heterozygous allele (A/T). Heat map represents range of numerical values for each measure: Panels A-C yes (1 = red) vs, no (0 = blue); Panels D-E GOS-E range from less than 3 (blue) to 8 (red); Panel F PARP1 allele A/A = 1 = blue, A/T = 2 = yellow/green, T/T = 3 = red.

