
Figure 2. Representative force-extension curves (FEC) for the TSS using force ramping.
(A) FEC of the TSS in the absence of Mg2+ (N = 86). The red line represents the unfolding process and blue line represents the refolding process. The three intermediates are labeled. Insets show enlarged transitions. (B) FEC of TSS in Mg2+ (N = 64). The large and small rips in the unfolding process are labeled 1* and 3, respectively. (C, D, E) TSS was annealed with oligonucleotides complementary to H4b, H5, and H4a, respectively. FECs were conducted in the absence (middle) and presence (right) of Mg2+. The complimentary oligonucleotides are denoted with a red line. Note that the oligonucleotide complementary to H4a has no effect on the FEC. (F) FECs of TSS containing mutations in H4a (mH4a). All rips are numbered as for wt TSS.

Figure 2—figure supplement 1. Optical tweezer (OT) experimental set-up.
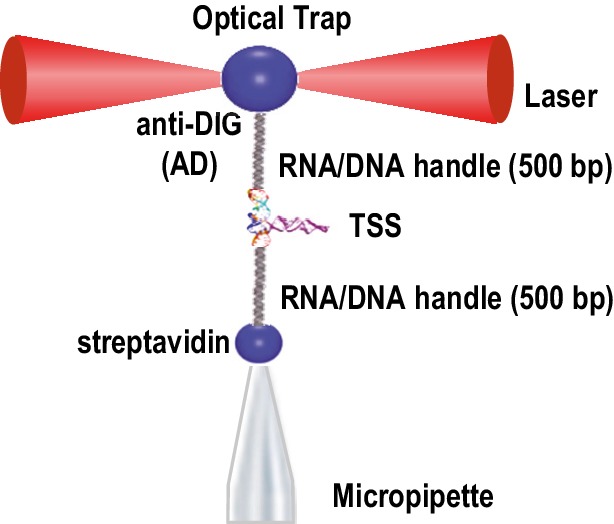
The TSS RNA was placed between 500bp DNA/RNA handles that interact either with the anti-DIG bead or the streptavidin bead (see text). The former bead was trapped by lasers and the latter by suction. RNA stretching was accomplished by increasing the distance between the two beads by moving the laser-trapped bead, allowing measurement of the RNA extension length.
Figure 2—figure supplement 2. Force extension curve (FEC) of the DNA/RNA handles alone.
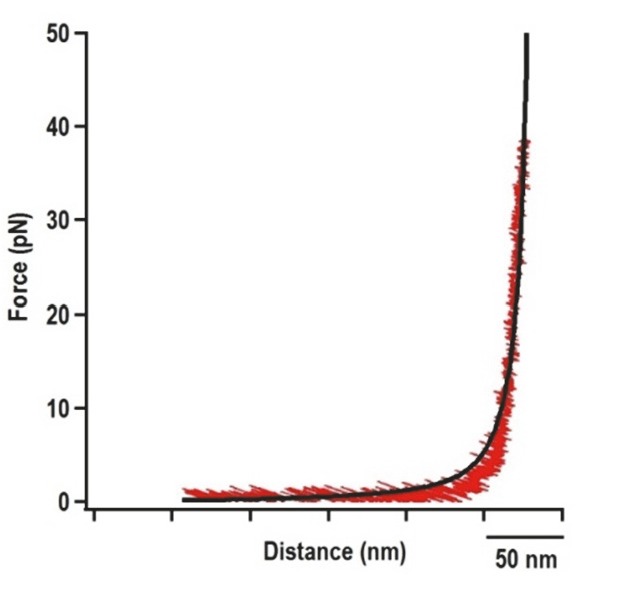
The 500 nt left and right handles were connected together and subjected to OT. Black line represents the FEC of DNA/RNA handles (red) fitted with the Makko-Sigga WLC model (Wang et al., 1997).