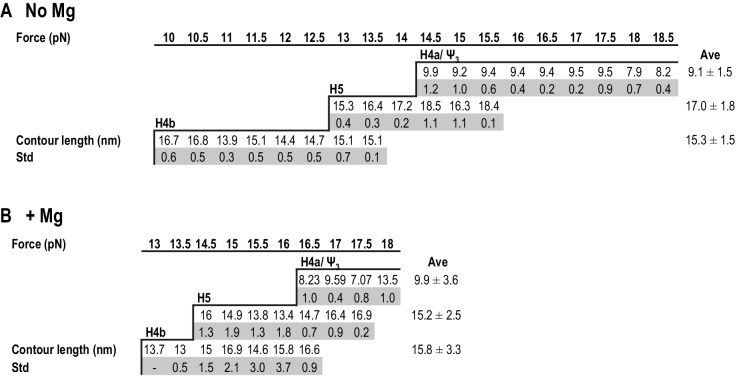
Figure 5. Summary of contour lengths of TSS elements obtained by force-clamping.
(A and B) Contour lengths of each transition in 250 mM NaCl and in 10 mM MgCl2, respectively. Std: standard deviation obtained for three independent measurements. Contour length of each transition measured at each force level was averaged (Ave).

