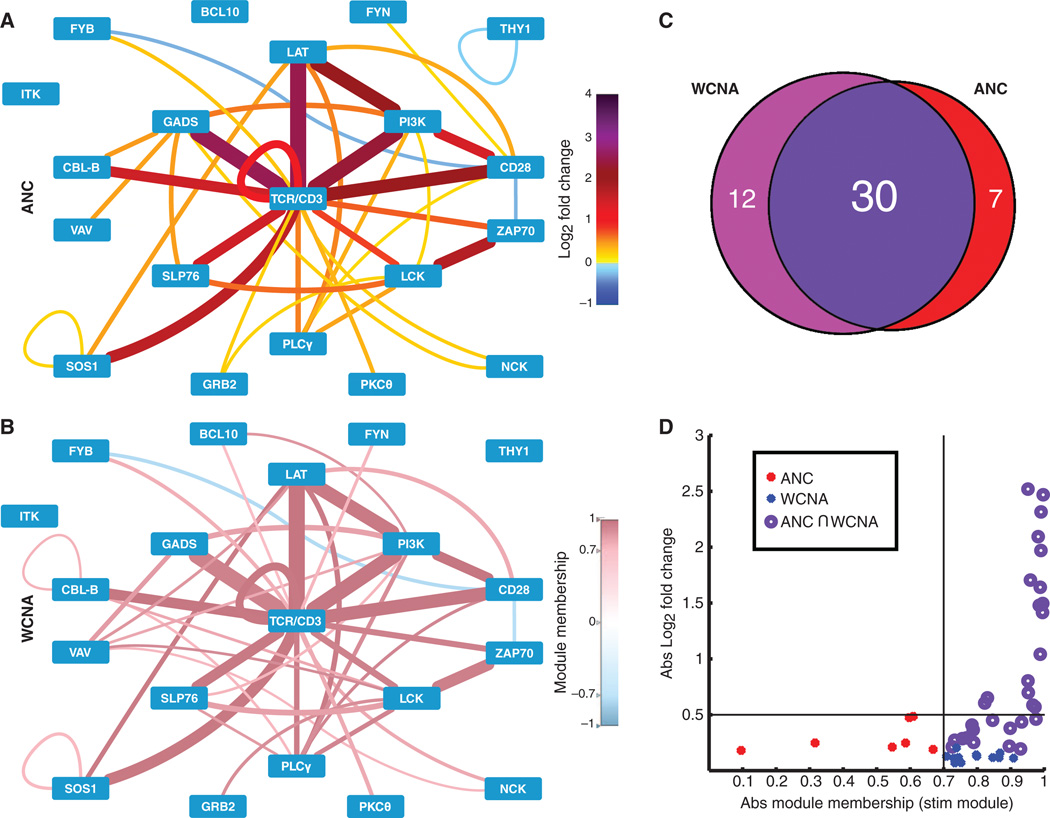
Fig. 3. Comparison of ANC and WCNA analyses.
(A) ANC analysis of four independent SEE stimulation experiments identified PiSCES that exhibited statistically significant changes in three of four experiments for the SEE data set. Edge color and thickness correspond to mean log2 fold change (color legend on the right). (B) WCNA analysis of the MFI values from the same SEE data set. PiSCES with MM > 0.7 in the turquoise stimulation network (see fig. S4 and Materials and Methods) are visualized in the node-edge diagram. Edge thickness corresponds to mean log2 fold change, whereas edge color corresponds to MM (color legend on the right). (C) Venn diagram of the overlap between both methods of analysis. Because most hits coincided between the two analyses, we concluded that the two analyses produced compatible results. (D) Hits identified by ANC (red), WCNA (blue), or both (dark purple) are graphed by the absolute value (Abs) of mean log2 fold change and the absolute value of MM in the stimulation (stim) (turquoise) module.

