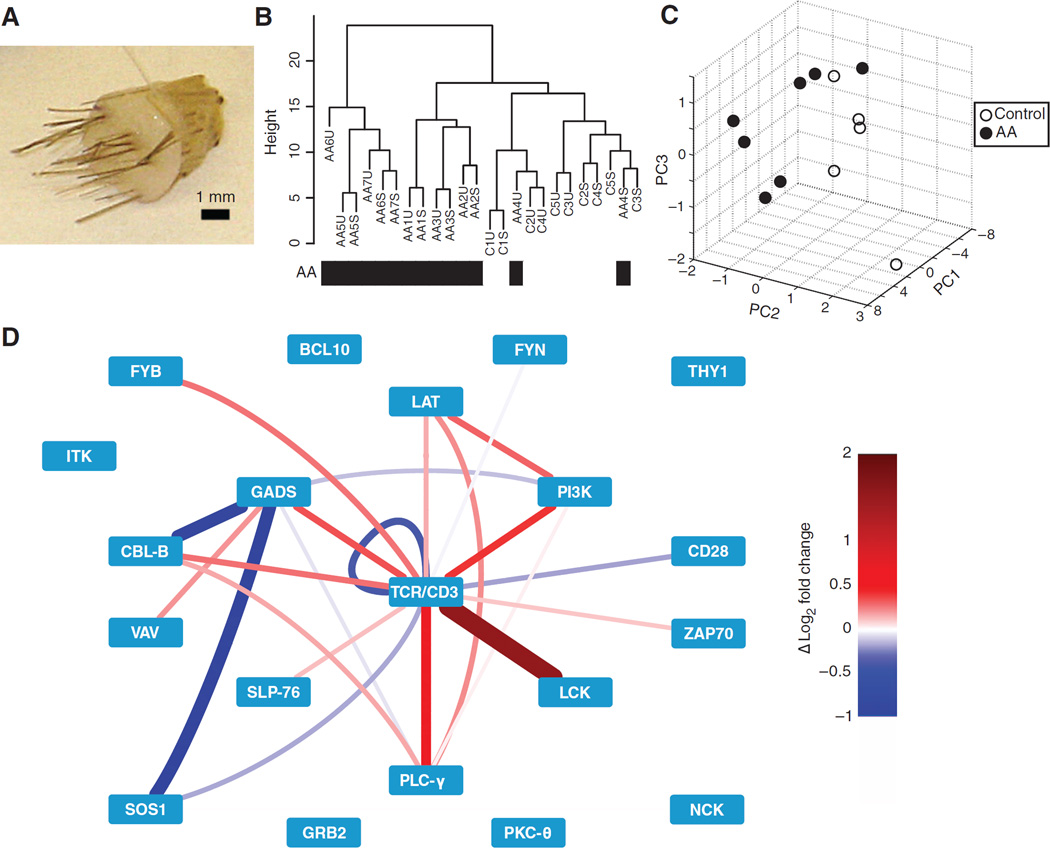
Fig. 6. PiSCES network analysis of clinical biopsies distinguishes the alopecia areata patient group from the control patient group and suggests enhanced basal TCR signaling network activity in alopecia areata.
(A) A 4-mm scalp punch biopsy from which T cells were isolated. (B) Hierarchical clustering of the normalized fold changes in MFI predominately separates the seven alopecia areata patient samples from the five control patient samples. S, exogenously stimulated; U, unstimulated. P = 0.015, extension of Fisher’s exact test. (C) PCA of basal (not exogenously stimulated) PiSCES activity among all stimulation-responsive protein complexes (identified in fig. S5) separates alopecia areata patient samples from control patient samples. (D) Difference in the basal activity of stimulation-responsive network PiSCES in the alopecia areata patient group as compared to the control patient group (red indicates greater activity in the alopecia areata cells; blue indicates greater activity in the control patient cells) suggests that more stimulation-responsive PiSCES were basally increased in relative abundance in the alopecia areata patient group versus the control patient group. P = 0.039 with control-clustered patient AA4 removed; P = 0.115 with patient AA4 included, using a resampling-based test.

