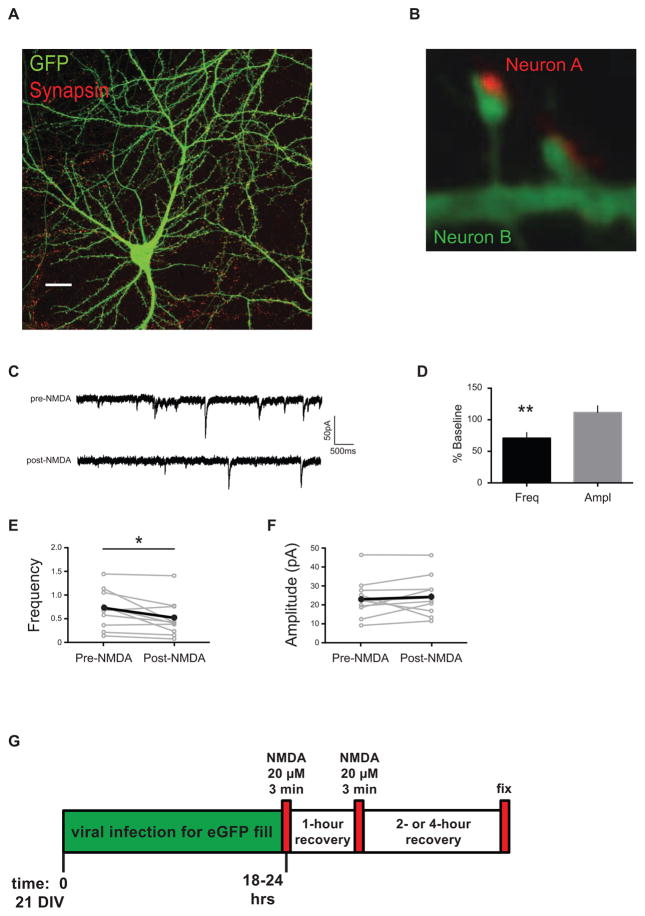
Figure 1. Experimental design.
(A) Dissociated neuronal cultures at 18 – 22 days DIV have fully-branched dendrites studded with mature spines that can be visualized with fluorescent markers using confocal microscopy, and the changes in synapse density can then be quantified. Scale bar, 20 μm. (B) High magnification confocal images of dendrites with spiny synapses. Synapsin antibody staining (red) in the presynaptic terminal of Neuron A is apposed to the GFP-labeled spines and dendrite (green) of postsynaptic Neuron B. NMDA treatment of dissociated neuronal cultures causes a decrease in frequency of miniature EPSCs. (C) Representative traces from mEPSCs recorded from cultured neurons pre- and post-NMDA treatment. (D) Data from cells, normalized to baseline, after NMDA treatment shows a decrease in mEPSC frequency, but no change in amplitude (n = 10 cells, 3 biological samples). Paired analyses of mEPSC recordings from individual cells pre-NMDA and post-NMDA treatments: (E) frequency and (F) amplitude. Some points/error bars are obscured by overlying symbols with similar values. * p freq = 0.031. (G) Schematic diagram of experimental timeline showing that dissociated neurons were cultured for 21 days, infected with a modified Sindbis-eGFP to fill some of the cells, treated twice with the LTD-inducing drug, NMDA (20μM for 3 minutes), allowed to recover two or four hours, and fixed. Cells were then stained for synapse markers (immunofluorescence), imaged, and putative synapse numbers determined.

