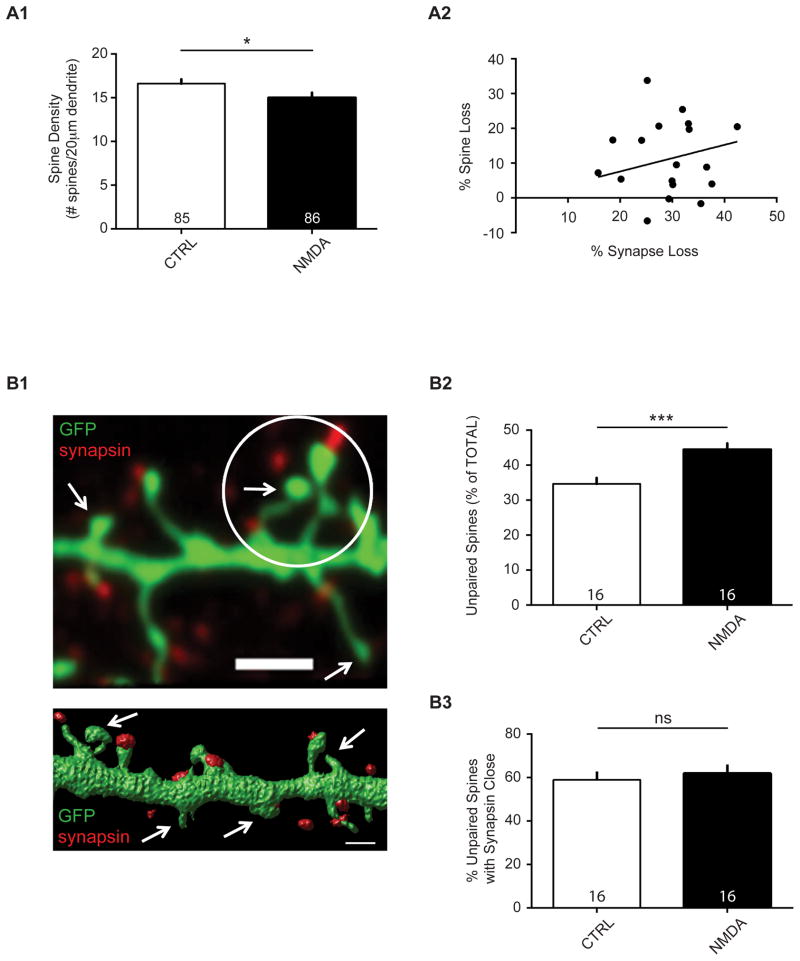
Figure 4. NMDA treatment results in spine loss.
(A1) Data are averaged means of spine density (# spines/20 μm dendrite) in cultured neurons after mock or NMDA treatment from 16 independent experiments. Values within bars represent sample sizes (# neurons). Error bars represent SEM. Significance from control (CTRL): * p = 0.025. (A2) Spine loss is not correlated with putative synapse loss. Data are averaged means of spine and synapse numbers, expressed as % spine loss and % synapse loss, in cultured neurons after mock or NMDA treatment from 16 independent experiments. R2 = 0.014; p = 0.636. (B1) Confocal image (top; scale bar, 2 μm) and surface rendering (bottom; scale bar, 1 μm) of spiny dendritic sections (GFP-expressing) with punctate antibody staining to endogenous synapsin protein. Arrows indicate examples of ‘unpaired spines’. Circle marks a 2-μm radius region of interest for an ‘unpaired spine with synapsin close’. Center of the white circle is on an unpaired spine head center; any unpaired synapsin within the circle denotes ‘synapsin close’. (B2) NMDA treatment increases the number of unpaired spines (without synapsin, as a % of the total number of spines; ***p = 0.0004), but not (B3) unpaired/nonsynaptic spines with synapsin close (ns, not significant; p = 0.61). Values within bars represent sample sizes (# neurons). Error bars represent SEM. Significance from control (CTRL): *** p < 0.001; ns, not significant.

