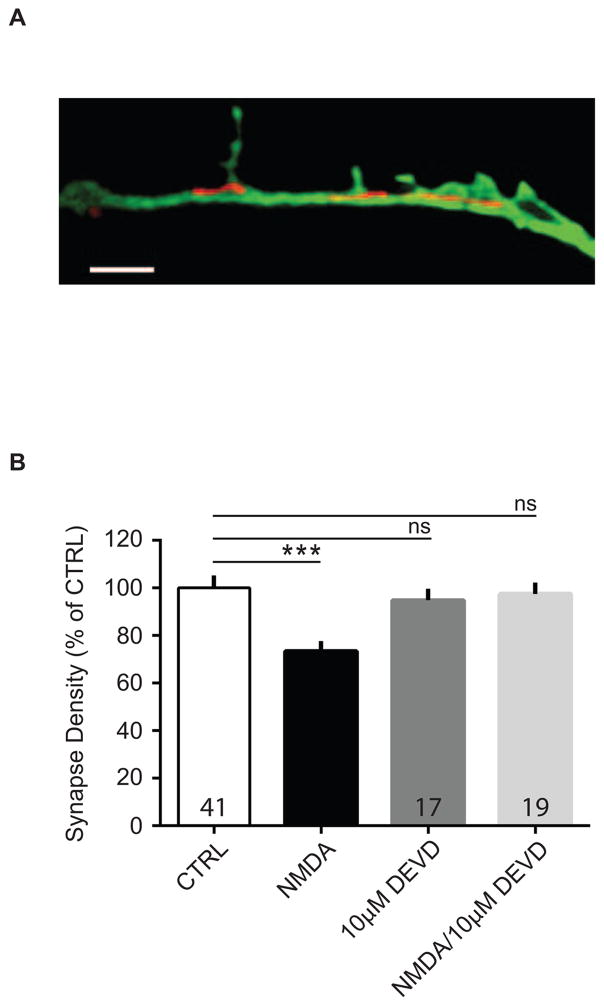
Figure 6. Caspase-3 inhibition blocks NMDA-induced synapse elimination.
(A) 3-D SIM image of MitoTracker Red-stained mitochondria in a dendrite from a GFP-expressing cultured neuron. Scale bar, 2 μm. (B) Cultured neurons were treated twice with NMDA (20 μM for 3 min) alone, NMDA plus caspase-3 inhibitor, z-DEVD-FMK (DEVD), DEVD alone, or vehicle-treated, and processed for immunocytochemistry after 2 hrs. Quantification of the effect of DEVD on NMDA-induced changes in synapse density from neurons stained with GFP and synapsin. Data are averaged means of synapses from three biological samples. Values within bars represent sample sizes (# neurons). Error bars represent SEM. Significance from control (CTRL): *** p < 0.001.

