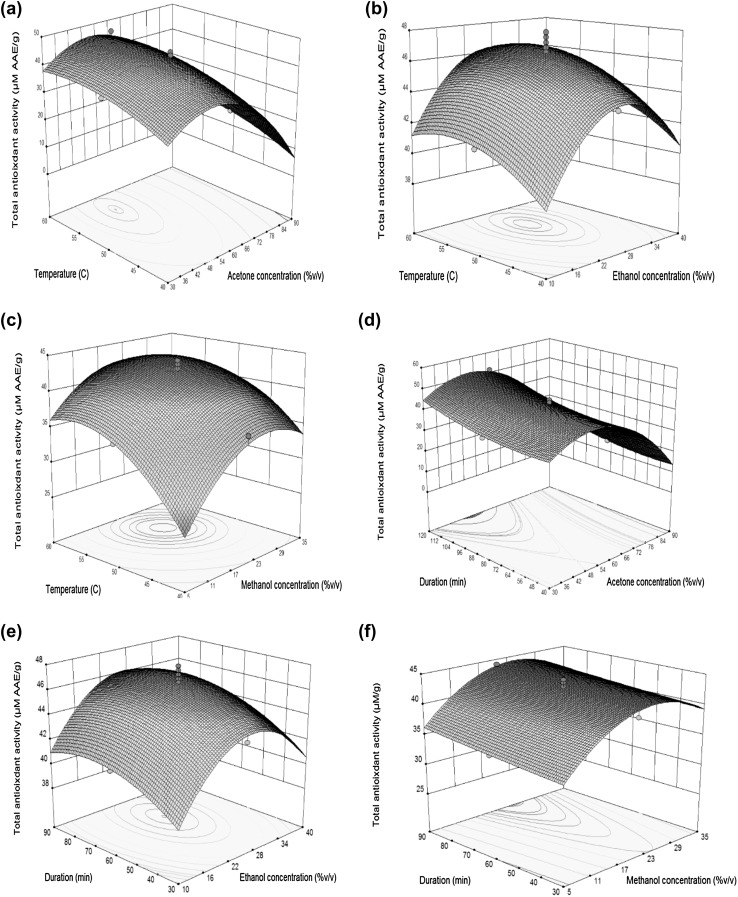
Fig. 1.
Response surface plots of whole mung bean showing the effect of solvent, temperature and extraction duration on TAA (a acetone concentration and temperature at 80 min; b ethanol concentration and temperature at 60 min; c methanol concentration and temperature at 60 min; d acetone concentration and duration at 50 °C; e ethanol concentration and duration at 50 °C; f methanol concentration duration at 50 °C)

