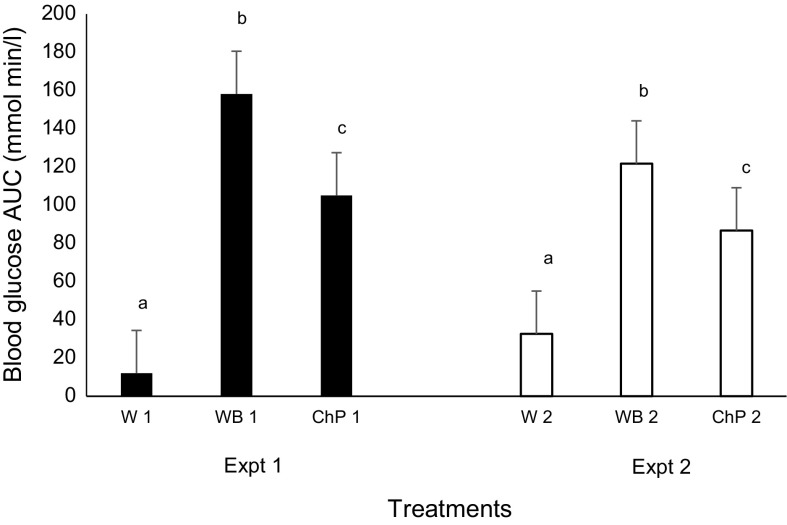
Fig. 3.
Effect of treatments on the blood glucose area under the curve 0–60 min in Experiment 1 and 0–120 min in Experiment 2 in healthy female subjects. Data presented is as Mean ± SEM, n = 12 in Experiments 1 and 2; Different superscript letters denote a significant difference at p < 0.05 within the same Expt (Tukey’s posthoc test). Expt experiment; W water, WB white bread, ChP Chickpeas; “1” denotes Expt 1 and “2” Expt 2

