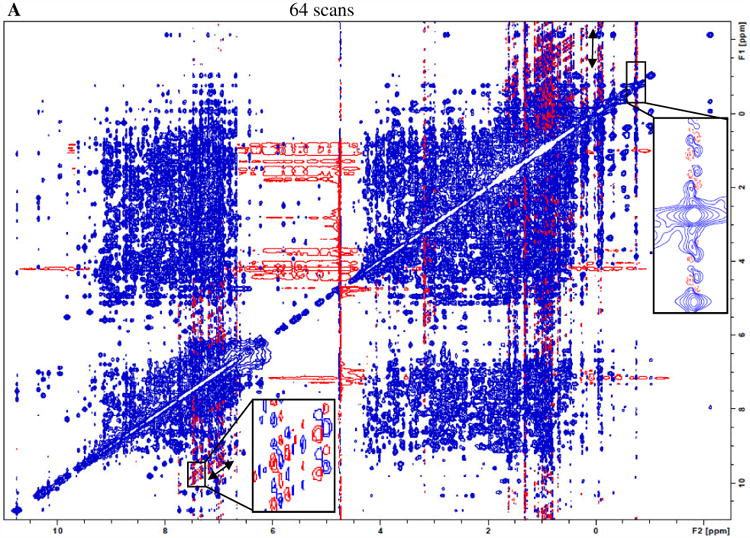
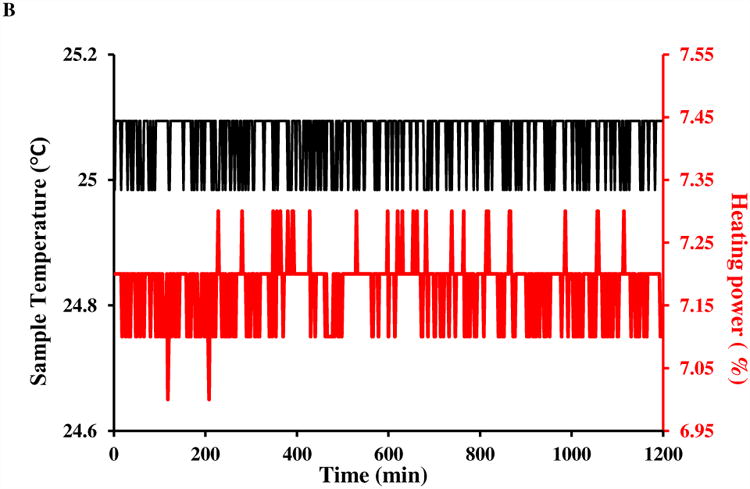
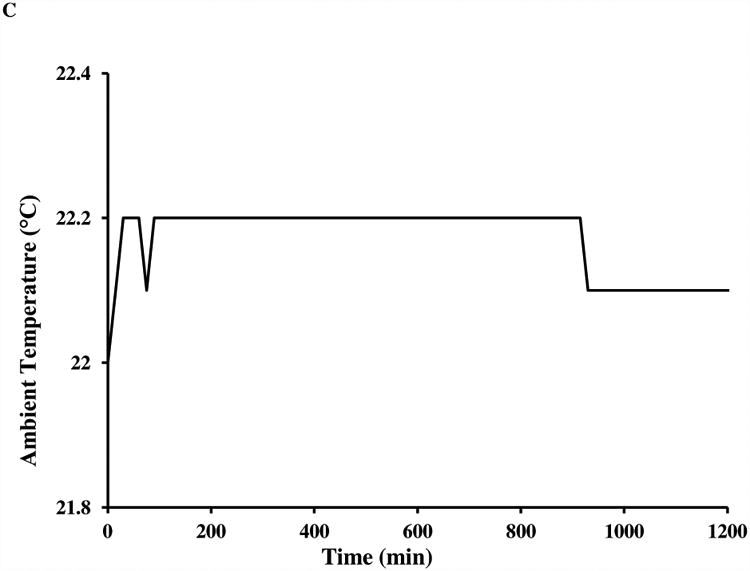
Figure 1.


A) An 800 MHz NOESY spectrum with conventional acquisition of 64 scans for 5 mM lysozyme in H2O:D2O=90%:10% at 25 °C. The regions with F2 chemical shift between 6.7 and 7.7 ppm, and between 0.8 and 2.7 ppm show more severe t1 noise (streaks) than others. Both the real-time sample temperature control (sample temperature and heating power are shown in part B) and ambient temperature (shown in part C) were deemed to be satisfactory throughout the data acquisition.
