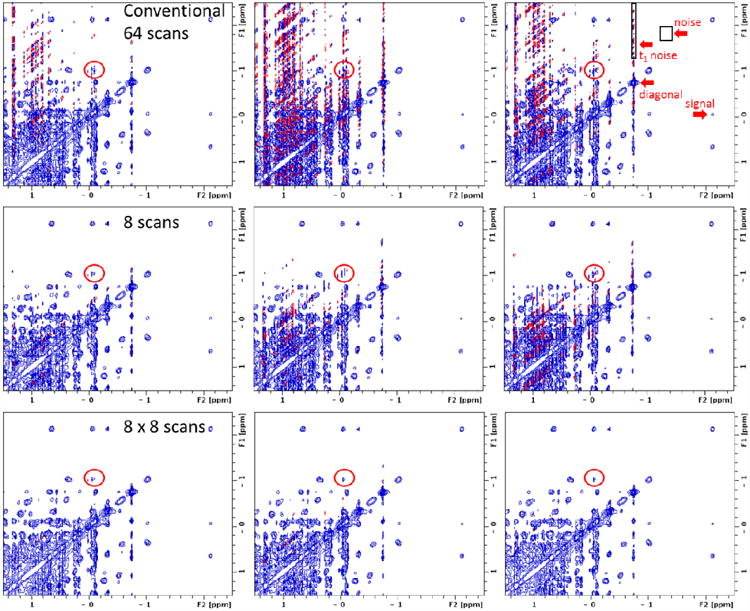
Figure 3.

Direct comparison of three NOESY acquisition methods (aliphatic region of lysozyme). From top to bottom, the acquisition methods are: conventional with 64 scans per increment; 8 scans per increment (plotted with intensities scaled up by a factor of 8); sum of eight 8-scan per increment spectra (8 × 8-scan co-addition). From left to right, each acquisition is repeated three times. Red circles show a cross-peak that can be clearly and consistently identified in the 8 × 8-scan co-addition (bottom row) but not as clearly in 8-scan only (middle row) or not at all by conventional 64-scan (top row) spectra. Regions selected for statistical analysis of t1 noise, random noise and a genuine cross-peak (Table 1) are labeled on the top-right spectrum.
