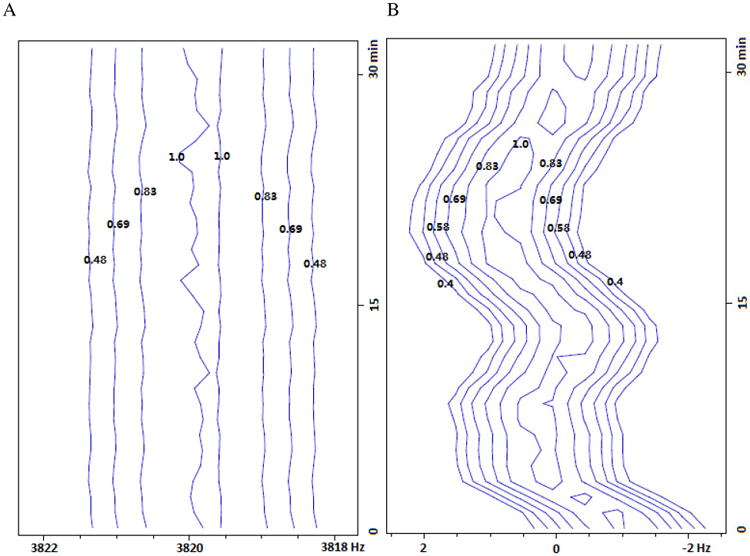
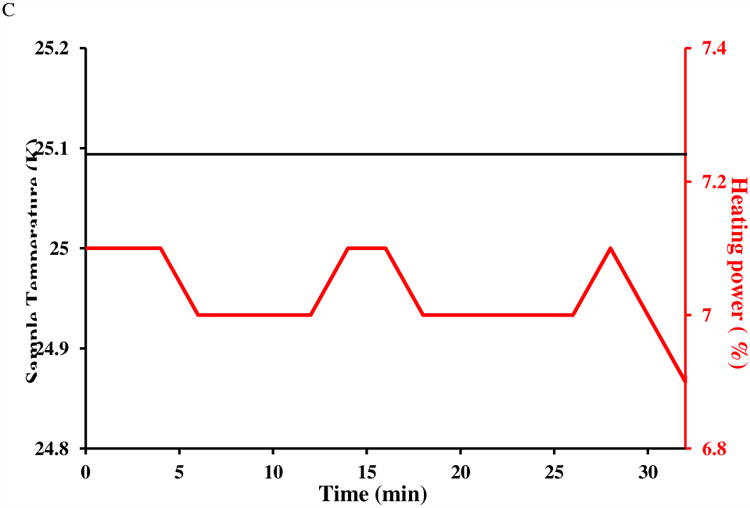
Figure 4.


A frequency drift test for 0.1% DSS in 0.1 mg/ml GdCl3 doped 99% D2O at 25 °C. Plotted are pseudo-contours (with relative intensity labeled on each level) of 32 stacked 1D proton spectra acquired in 32 minutes for the regions of A) residual proton resonance and B) DSS. Horizontal frequencies are offsets to spectrometer base frequency. In A), water's residual proton resonance frequency does not show any significant drift (< 0.2 Hz) suggesting good stability in internal spectrometer frequency, resonance line-shape and transmitter/receiver efficiency. In B), DSS frequency drifts (relative to the residual proton frequency) about 1 Hz from the mean, presumably due to sample temperature fluctuation of 0.1 °C or higher. The spectrometer was locked to the solvent's deuterium signal and the sample had equilibrated more than 5 minutes after target temperature was reached. Thermocouple-reported sample temperature and heating element output during the drift test are plotted in C).
