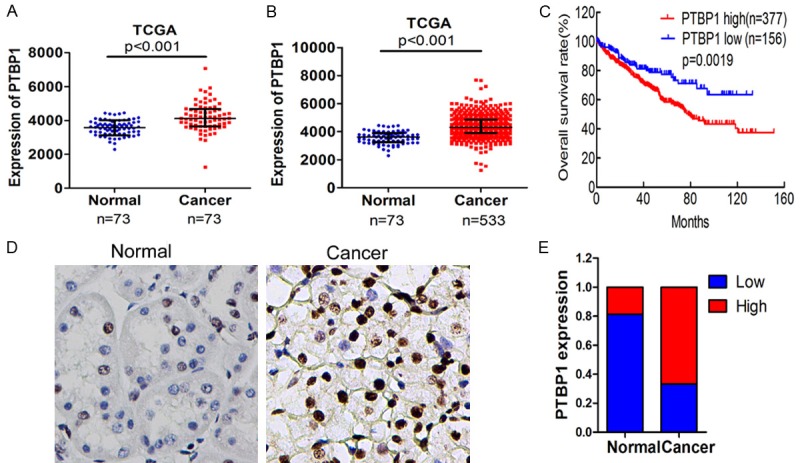
Figure 1.

PTBP1 is upregulated in ccRCC tissues. A. PTBP1 expression in normal renal tissues and ccRCC tissues of 73 patients was downloaded from the TCGA database and compared by paired t test. B. PTBP1 expression level in normal tissues and cancer tissues of 533 patients from TCGA was compared by t test. C. The overall survival rates of the 533 RCC patients were compared according to low- and high-PTBP1 level by Kaplan-Meier method with log-rank test. D. The expression of PTBP1 was detected in ccRCC tissues and normal renal tissues by IHC, and representative samples are shown at 400× magnification. E. IHC expression of PTBP1 quantified by H-score in normal tissues and ccRCC tissues. The samples were classed as low (H-score, < 150) or high (H-score ≥ 150) PTBP1 expression.
