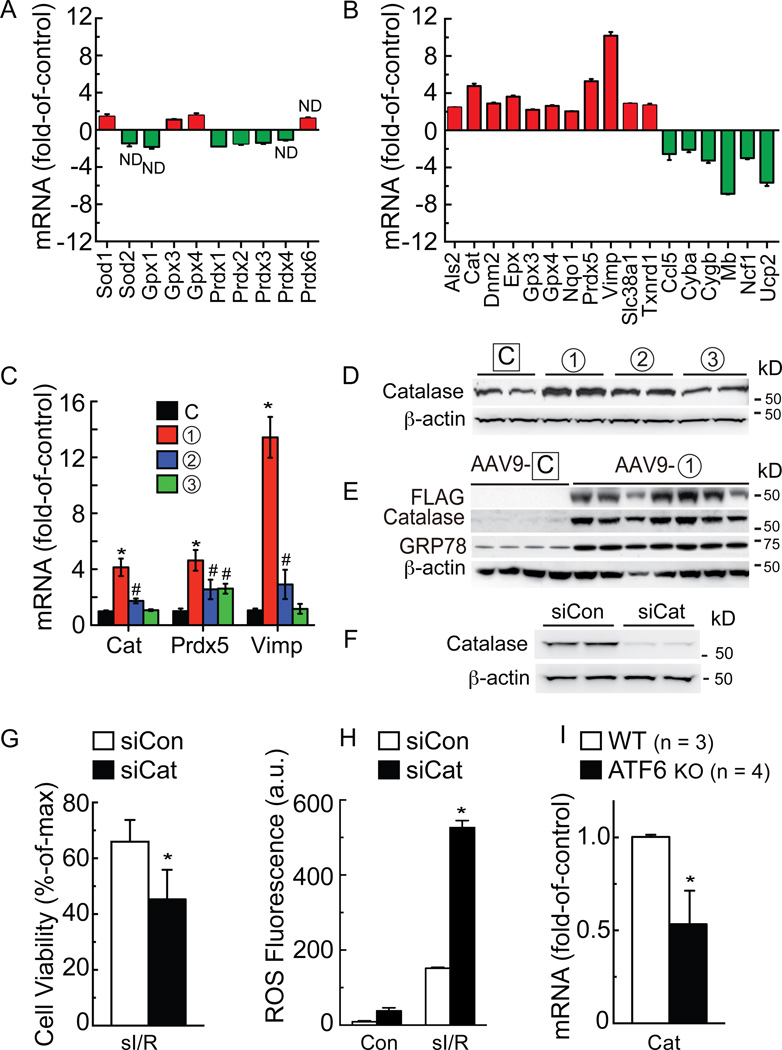
Figure 6. Analysis of oxidative stress gene expression.
A and B, NRVM were infected with AdV-Con or AdV-ATF6 (form 1), then RNA was subjected to qRT-PCR for the genes shown (A), or analyzed with an oxidative stress gene array (B). Shown are only genes that were increased (red) or decreased (green) by ATF6. In A and B all values were p<0.05 different than control by t-test, unless marked ND (no difference). C and D, NRVM were infected with the AdV-ATF6 shown, then RNA was isolated and analyzed for catalase (Cat), peroxiredoxin 5 (Prdx5), and Vimp mRNA by qRT-PCR (C), * # p<0.05 different than all other values for each target gene, and protein was analyzed for catalase levels by immunoblotting (D). E, WT mice were injected with AAV9-control or AAV9-CMV-FLAG-ATF6 form 1. Two weeks later, mice were sacrificed and hearts were analyzed for FLAG-ATF6, catalase, GRP78 and β-actin by immunoblotting. F, NRVM were transfected with siCon or siCat RNAs; 48h later, culture extracts were examined for catalase and β-actin. G, H, NRVM were transfected with siCon or siCat RNA, subjected to sI/R, then analyzed for cell viability by calcein blue AM staining (G), or for ROS by Amplex Red (H). I, following I/R, WT (n = 3) and ATF6 KO (n = 4) mouse heart extracts were analyzed for Cat mRNA levels, normalized to β-actin mRNA by qRT-PCR. * p<0.05 different from siCon (G, H) or WT (I) by t-test.

