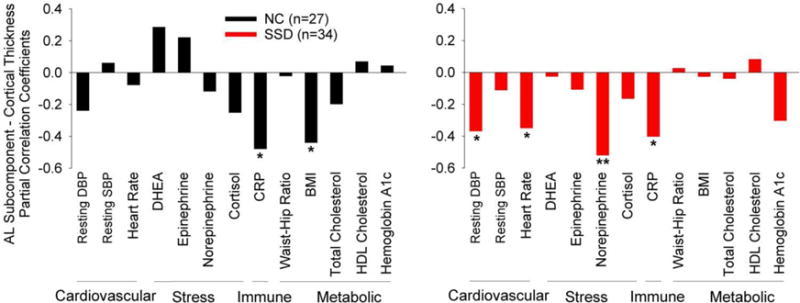
Figure 3.

Age-corrected partial correlation coefficients between cortical thickness and individual components of the allostatic load index in normal controls (NC) and schizophrenia spectrum disorder patients (SSD). Y-axis: partial correlation coefficients. Note that DHEA and HDL are inverse measures of allostatic load (higher levels indicate lower AL). * Nominally significant at p<0.05. ** Significant after Bonferroni correction of 13 comparisons at p<0.004
