
Figure 4. Results from the analysis of the mdNLR within the ovarian cancer, breast cancer, and aging data sets.
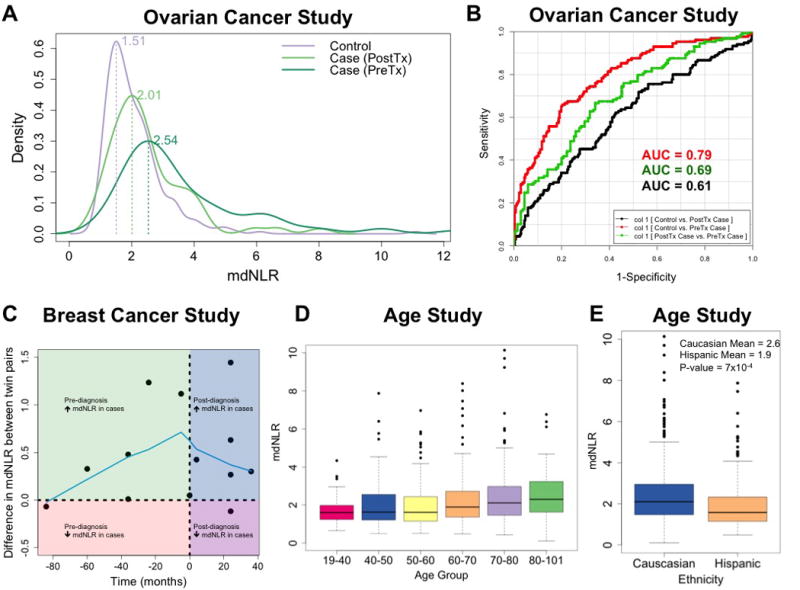
(A) Distribution of the mdNLR between pre-treatment ovarian cancer cases, post-treatment ovarian cancer cases, and age-matched cancer-free controls. (B) ROC curves demonstrating the ability of mdNLR to correctly classify controls versus pre-treatment ovarian cancer cases (red line), controls versus post-treatment ovarian cancer cases (black line), and pre- versus post-treatment ovarian cancer cases (green line). (C) Scatter plot of the within twin-pair difference in the mdNLR between breast cancer cases and controls (y-axis) as a function of whole blood sample collection relative to cancer diagnosis (x-axis). Green quadrant indicates that samples were collected pre-diagnosis and that the mdNLR was higher among the twin-pair member that would eventually be diagnosed with breast cancer. Red quadrant indicates that samples were collected pre-diagnosis and that the mdNLR was lower among the twin-pair member that would eventually be diagnosed with breast cancer. Blue quadrant indicates that samples were collected post-diagnosis and that the mdNLR was higher among the twin-pair member diagnosed with breast cancer. Purple quadrant indicates that samples were collected post-diagnosis and that the mdNLR was lower among the twin-pair member diagnosed with breast cancer. Blue line represents the lowess-smoothed curve estimated using all 13 twin pairs (D) Distribution of mdNLR as a function of age group among the samples in the aging study. (E) Distribution of mdNLR as a function ethnic background among the samples in the aging study.