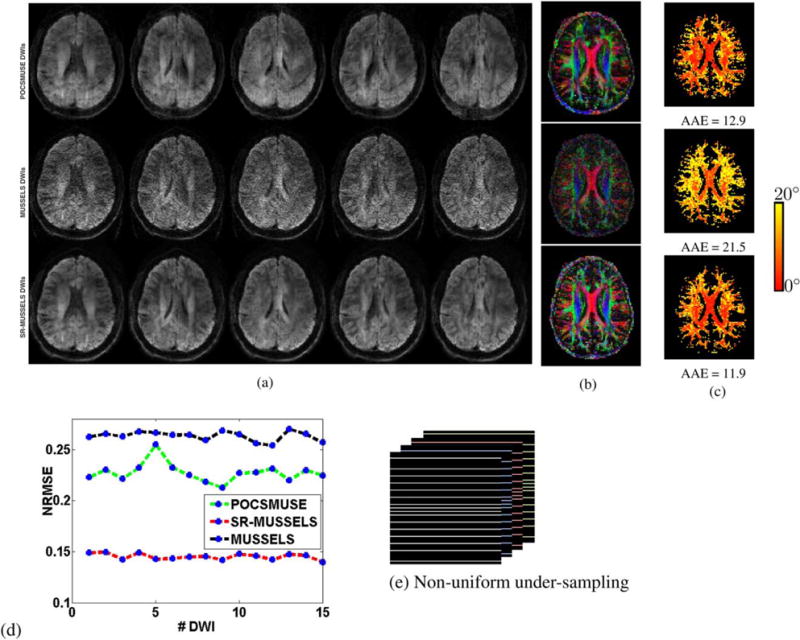
FIG. 8.

(a) the rows show the POCSMUSE, MUSSELS and SR-MUSSELS reconstruction of the first 5 out of 15 DWIs reconstructed from non-uniformly under-sampled data. The corresponding DEC maps (b) and the angular error maps (c) are shown on the right. Residual aliasing are clearly visible in the POCSMUSE reconstructions although this is not evident in its DEC maps. The NRMSE error for each of the DWI are plotted in (d) and the under-sampling pattern used is shown in (e).
