Fig. 2.
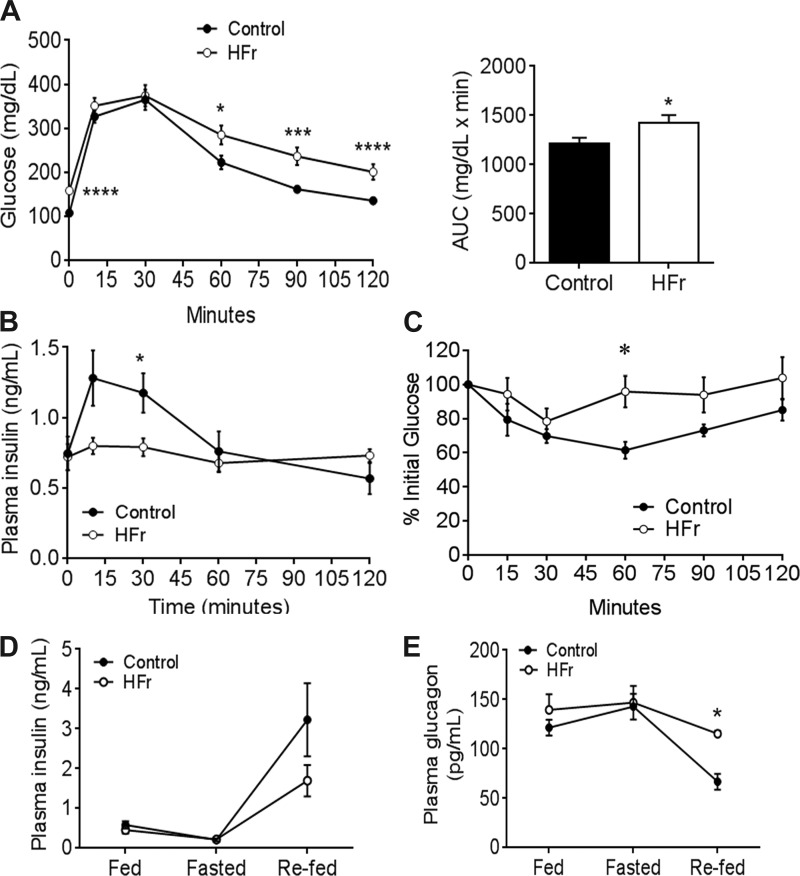
High-fructose consumption impairs glucose homeostasis. A, left: blood glucose levels over time following an intraperitoneal injection of 2 mg/g glucose; n = 16 in each group. A, right: area under the curve (AUC). B: insulin response during the glucose tolerance test; n = 11–12 mice. C: blood glucose levels following an intraperitoneal injection of 0.5 U insulin; n = 6 in each group. D and E: fed, fasting, and refed plasma insulin (D) and glucagon (E) levels; n = 4–6. Data are presented as means ± SE. *P < 0.05, ***P < 0.01, and ****P < 0.0001 by Student’s t-test.

