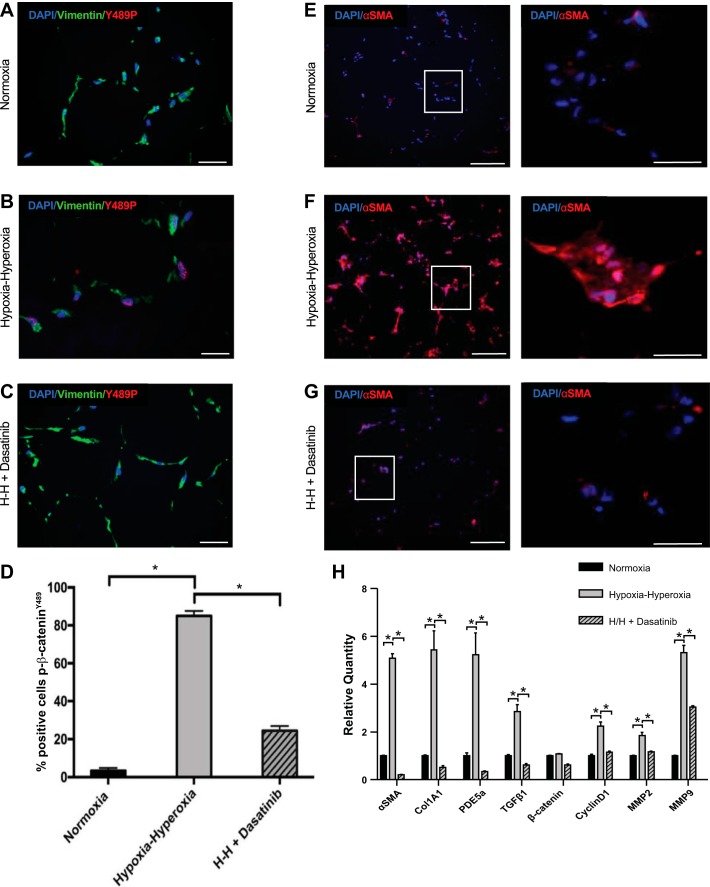
Fig. 4.
Inhibition of tyrosine kinase with dasatanib with decreased p-β-cateninY489 localization and fibroblast activation in the mesenchymal organoid model. A–C: IF for p-β-cateninY489 (red) and vimentin (green) of FLF organoids grown in normoxia, hypoxia-hyperoxia (H-H), and hypoxia-hyperoxia + 100 nm dasatanib added to culture media. Scale bar = 50 µm. E–G: IF for α-SMA (red) in FLF organoids grown in normoxia, hypoxia-hyperoxia, and hypoxia-hyperoxia with 100 nm dasatanib added to culture media. Scale bar = 50 µm. D: quantification of percentage of cells positive for p-β-cateninY489; 10 high-powered fields were counted 3 times for each condition; *P < 1 × 10⁻⁴. H: qPCR for markers of fibroblast activation seen in BPD, α-SMA, Col1A1, TGFβ1, and PDE5a, as well as β-catenin and downstream targets of Wnt signaling Cyclin D1, MMP2, and MMP9. *P < 0.001. Triplicate samples were used in each experiment. Experiments were repeated a minimum of 3 times.

