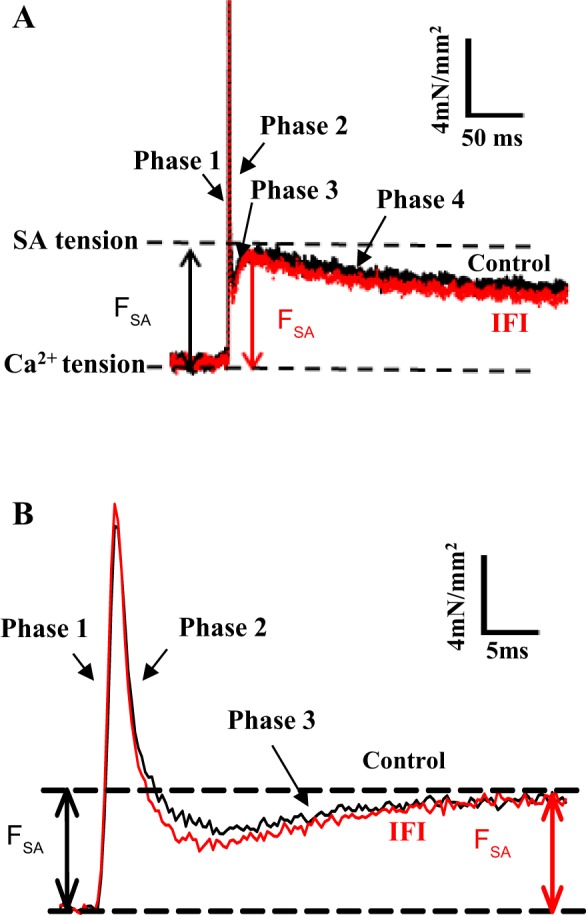
Fig. 1.

Comparison of IFI and control jump muscle fiber SA responses. A: representative tension traces following a 1% ML step over 0.5 ms from control (black) and IFI (red) fibers at 8 mM Pi. B: tension traces from A on an expanded time axis to show phases 1, 2, and 3 more clearly.
