
Fig. 2.
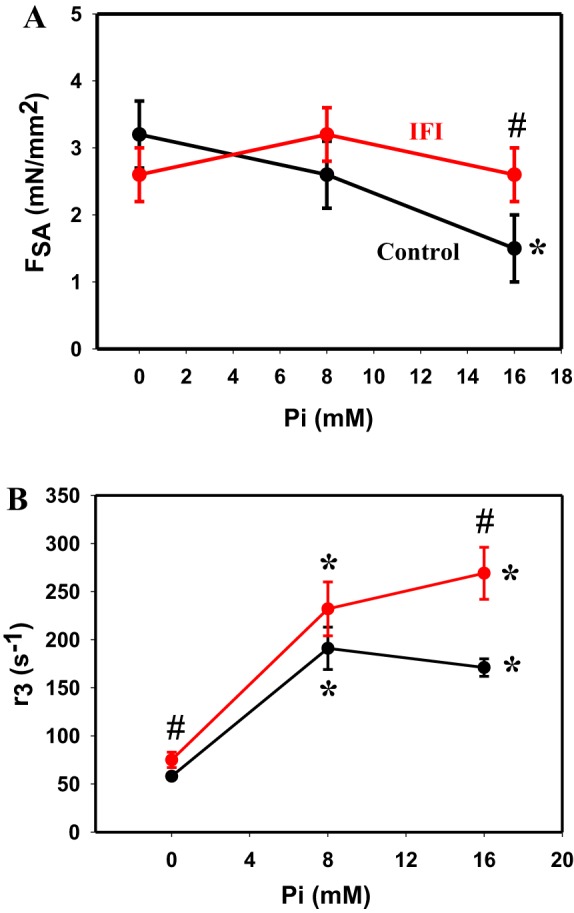
SA tension and kinetics of IFI and control jump muscle fibers. A: stretch-activated tension (FSA) of IFI (red) and control fibers (black) plotted vs. Pi concentration. Error bars show SE. B: rate of SA tension generation, r3 (rate of phase 3), of control (black) and IFI (red) fibers at three Pi concentations. Individual tension traces of SA responses following a 1% ML step over 0.5 ms were fitted to the sum of 3 exponential curves: a3[1 − exp(−r3t)] + a2exp(−r2t) + a4exp(−r4t) + offset. #P < 0.05 compared with control. *P < 0.05 compared with 0 mM Pi.