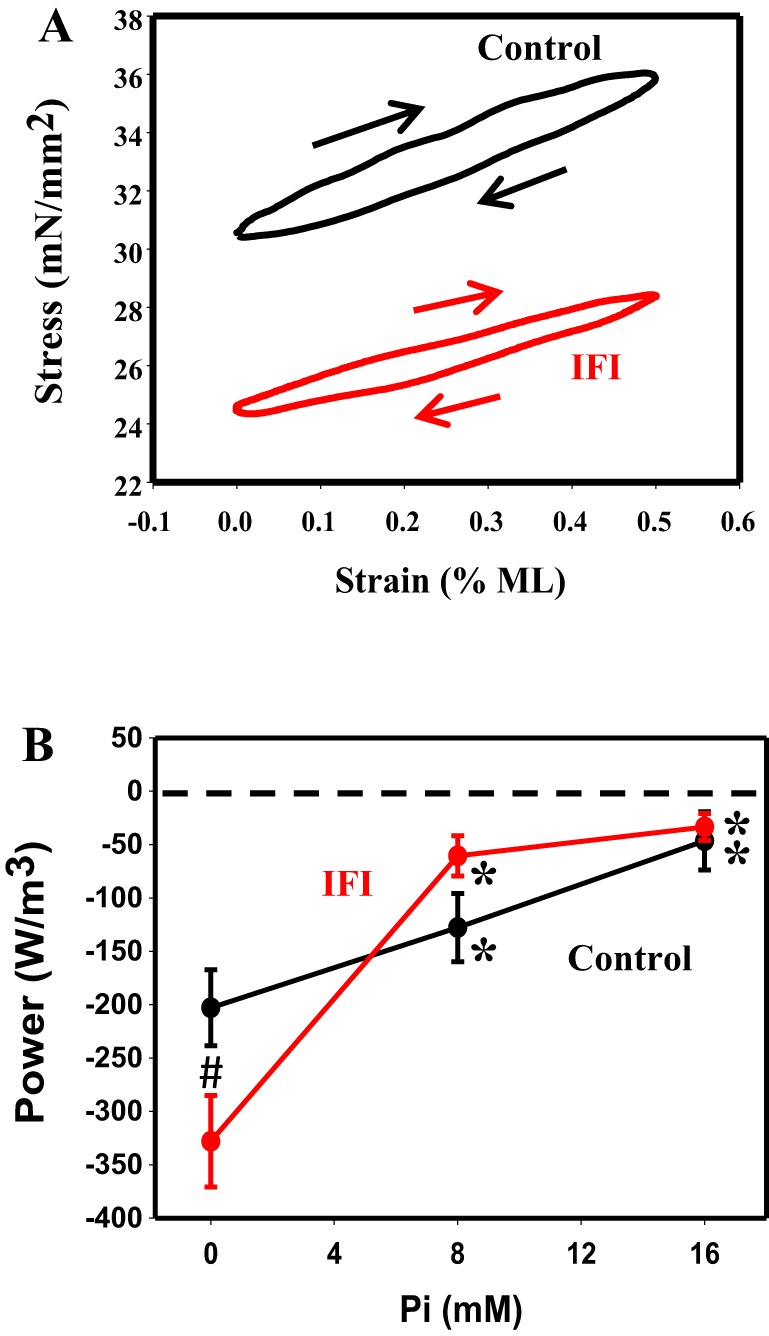
Fig. 3.

Work and power generation. A: representative work loop traces at 8 mM Pi. Arrows indicate the work loops were generated clockwise, indicating negative work (work absorption) and negative power. B: influence of [Pi] on work loop power generation. #P < 0.05 compared with control. *P < 0.05 compared with 0 mM Pi.
