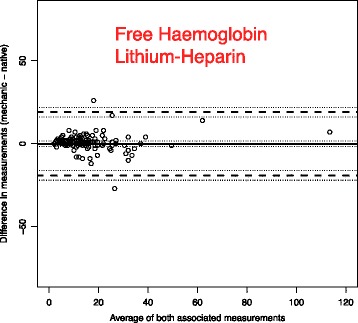
Fig. 6.

Free Haemoglobin in Lithium-Heparin preserved Serum (Unit: mg/l). Bland-Altman plots for selected biomarkers. The difference in measurements is plotted against the average value of both associated measurements. The margins of accuracy as given by the Rili-BAEK are drawn as sloping lines. Agreement is high. Variations are random and no systemical bias through treatment can be detected. Inaccuracy is well within the limits of the Rili-BAEK and within tolerance of clinical interpretation
