
Fig. 2.
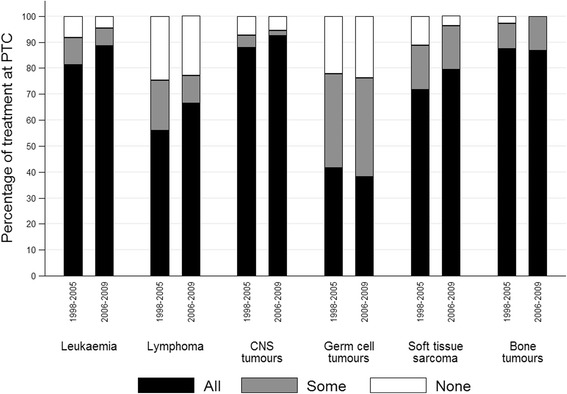
Level of treatment at PTC by diagnostic group and period of diagnosis, Yorkshire 1998–2009. Footnote: All = patient received all treatment at PTC. Some = patient received some treatment at PTC. Level of treatment at PTC “Some” ranges from 20 to 85% of all treatments received at PTC. None = patient received no treatment at PTC. PTC = Principal Treatment Centre