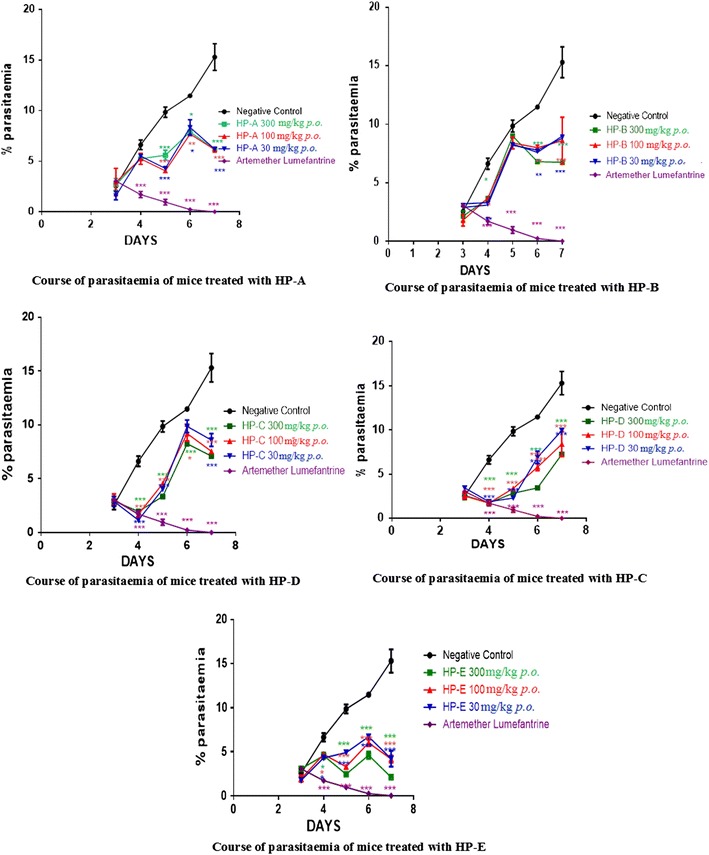
Fig. 3.

Time course of parasitaemia in mice treated with HPs. It shows the daily percentage parasitaemia of all three concentrations of HPs (300, 100 and 30 mg/kg body weight) compared to that of the negative control. Data is presented as mean ± SEM

Time course of parasitaemia in mice treated with HPs. It shows the daily percentage parasitaemia of all three concentrations of HPs (300, 100 and 30 mg/kg body weight) compared to that of the negative control. Data is presented as mean ± SEM