
Figure 2.
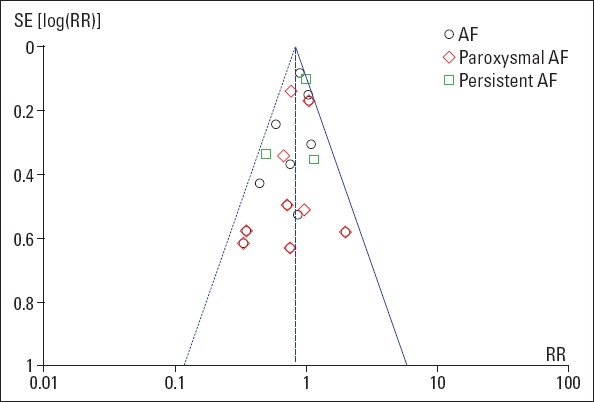
Funnel plot for the assessment of publication bias for the primary outcome. Effect size is plotted on the x -axis and SE on the y-axis.
AF - atrial fibrillation; RR - risk ratio; SE - standard error
Official websites use .gov
A
.gov website belongs to an official
government organization in the United States.
Secure .gov websites use HTTPS
A lock (
) or https:// means you've safely
connected to the .gov website. Share sensitive
information only on official, secure websites.
Funnel plot for the assessment of publication bias for the primary outcome. Effect size is plotted on the x -axis and SE on the y-axis.
AF - atrial fibrillation; RR - risk ratio; SE - standard error