Figure 3.

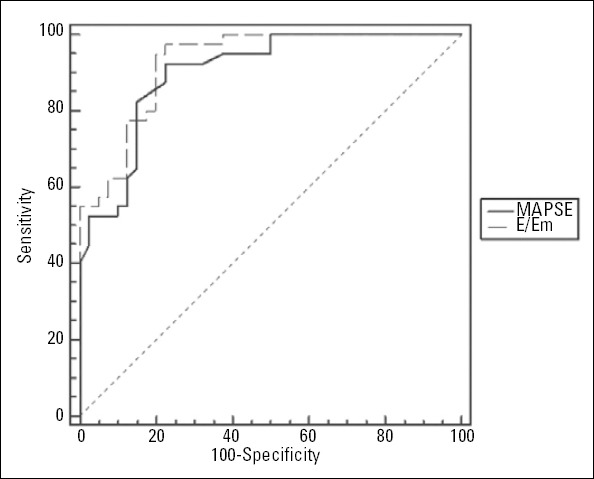
The pairwise comparisons of the ROC curves of MAPSE and the E/Em ratio in the diagnosis of DD [AUC 0.902 (0.033) vs. 0.927 (0.027); P=0.54]

The pairwise comparisons of the ROC curves of MAPSE and the E/Em ratio in the diagnosis of DD [AUC 0.902 (0.033) vs. 0.927 (0.027); P=0.54]