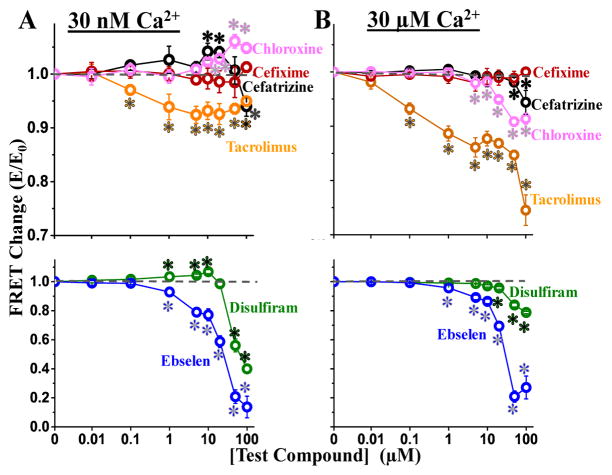
Figure 4.
Dose-response of screen Hits on FRET at 30 nM Ca2+ (A) and 30 μM Ca2+ (B). Symbols indicate FRET mean ± SE for chloroxine (pink), cefixime (red), cefatrizine PG (black) and Tacrolimus (orange) in the upper panels, and disulfiram (green) and ebselen (blue) in the lower panels. *Significantly different from the DMSO-only control using unpaired Student’s t-test, p > 0.05.

