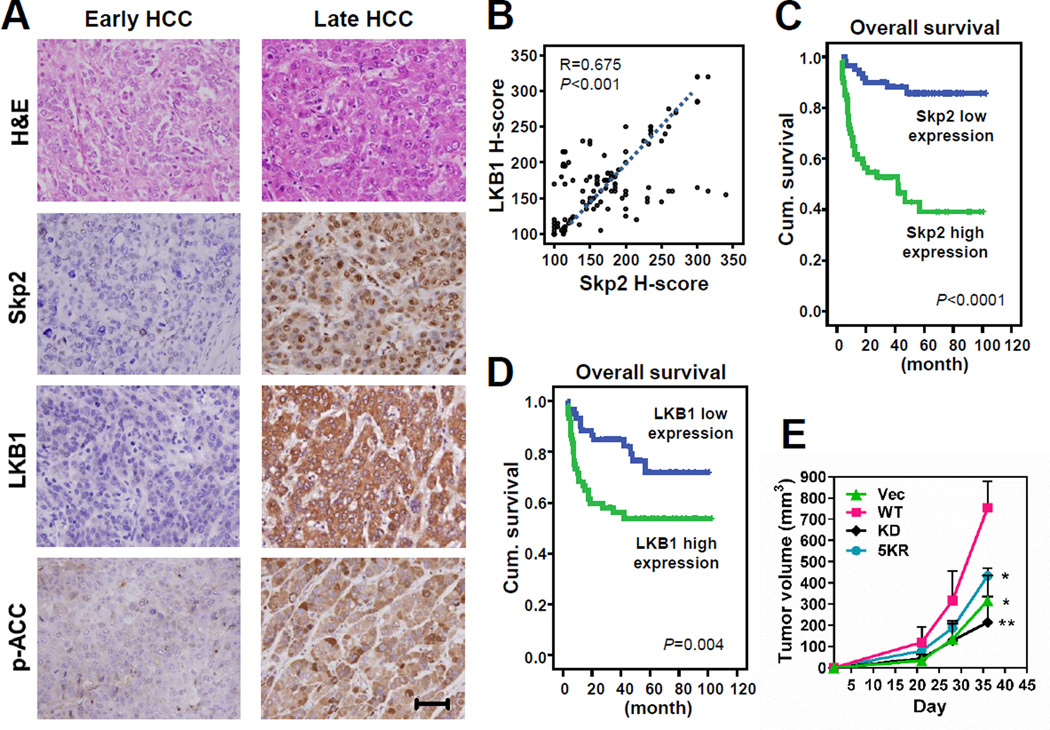
Figure 7. Both Skp2 and LKB1 are overexpressed in HCC and their overexpression predicts poor survival outcomes.
(A) Representative images of histological analysis of Skp2, LKB1 and p-ACC staining in early (left panel) and late-stage (right panel) HCC. Scale bar, 100 µm.
(B) Scatter plot of Skp2 expression versus LKB1 expression in HCC samples.
(C, D) Kaplan-Meier plots show that high expression of Skp2 (C) or LKB1 (D) is significantly predictive for inferior overall survival.
(E) Hep3B cells with stable transduction of the indicated Flag-LKB1 were subcutaneously injected into nude mice. Tumor size was measured by the caliper (n=3). The result is shown as means ± s.d. *P<0.05; **P<0.01.
See also Figure S7, and Tables S1, S2 and S3.

