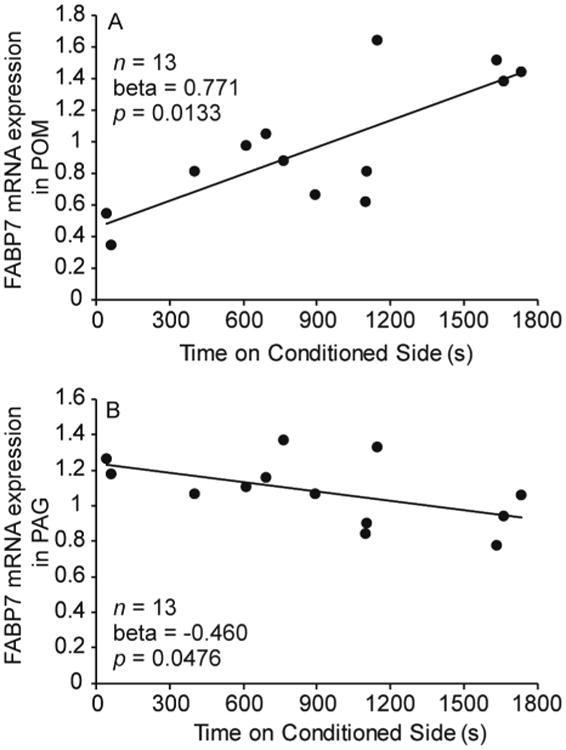
Figure 4.

Relationship between CPP (measured as the amount of time (s) on test day spent on the conditioned side of the apparatus) and FABP7 mRNA expression in (A) POM and (B) PAG. Beta and p values were determined with a multiple regression model (n = 13). Linear regression lines indicate a significant relationship (p ≤ 0.05).
