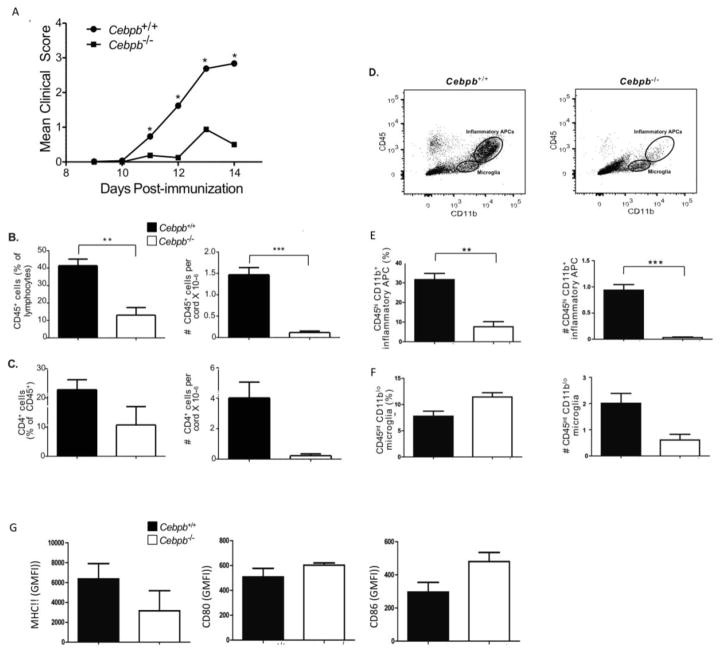
Figure 1. Cebpb−/− mice are resistant to EAE.
Cebpb+/+ and Cebpb−/− mice were immunized with MOG to induce EAE. A. Clinical EAE scores of Cebpb+/+ (n =52) and Cebpb−/− (n=9) mice, data are pooled from multiple experiments, statistical significance of EAE scores was assessed by Mann Whitney separately for each timepoint (* P <0.05). B. Percentage (left) and absolute numbers (right) of CD45+ cells gated from FSC/SSC lymphocyte gate in the CNS on day 14, Cebpb+/+ (n=31), Cebpb−/− (n=6). C. Percentage (left) and absolute numbers (right) of CD4+ cells in the CNS on day 14. Cebpb+/+ (n=15), Cebpb−/− (n=2). (D) Representative plots showing gating strategy to identify microglia and infiltrating macrophages from the CNS of C/EBPβ mice on day 14; (E) percentage (left) and absolute numbers (right) of CD45highCD11b+ infiltrating macrophages and (F) percentage (left) and absolute numbers (right) of CD45intCD11bint microglia. (G) MFI of MHC Class II (IA/IE), CD80, CD86 in CD45highCD11b+ macrophages, Cebpb+/+ (n=23–31) and Cebpb−/− (n=3–5). Data pooled from more than 3 independent experiments, except C is pooled from 2 experiments. Bars represent mean and SEM. **P<0.005 and ***P<0.0005 by student unpaired t-test.

