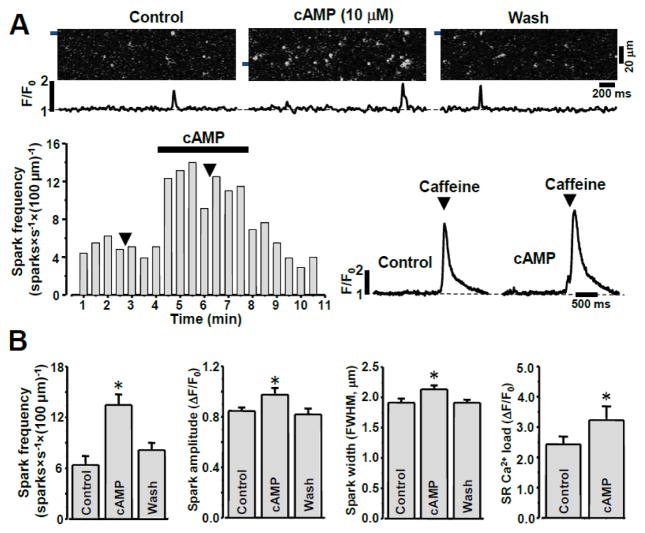
Figure 1. Effect of cAMP on Ca2+ sparks in permeabilized rabbit ventricular myocytes.
A Top, representative confocal line scan images with corresponding F/F0 profiles of Ca2+ sparks in control conditions, during addition of cAMP (10 μM), and following washout of cAMP. F/F0 profiles were obtained by averaging the fluorescence over the 1 μm wide regions indicated by the black bars. Bottom, representative example of cAMP effect on Ca2+ spark frequency and on SR Ca load estimated with caffeine. The black arrows indicate applications of caffeine in control conditions and during cAMP application. B, Ca2+ spark properties (frequency, amplitude, spatial width) and SR Ca2+ load in control conditions, during cAMP application, and after wash out of cAMP. *P<0.05 vs Control.

