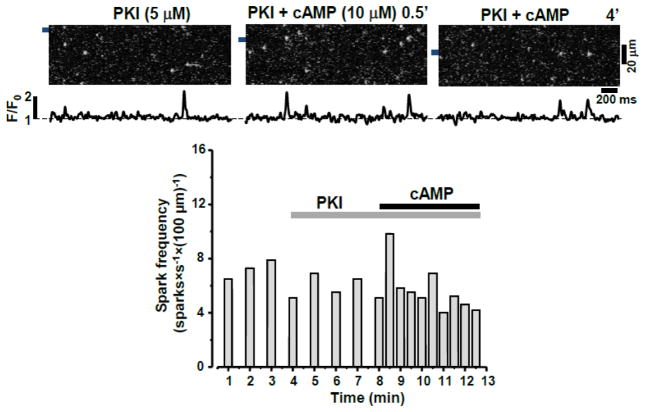
Figure 2. Effect of cAMP on Ca2+ sparks during inhibition of PKA.
Top, representative confocal line scan images with corresponding F/F0 profiles of Ca2+ sparks during treatment with PKI, followed by application of cAMP in the presence of PKI. F/F0 profiles were obtained by averaging the fluorescence signal over the 1 μm wide regions indicated by the black bars. Bottom, changes of Ca2+ spark frequency in the presence of PKI with and without cAMP present.

