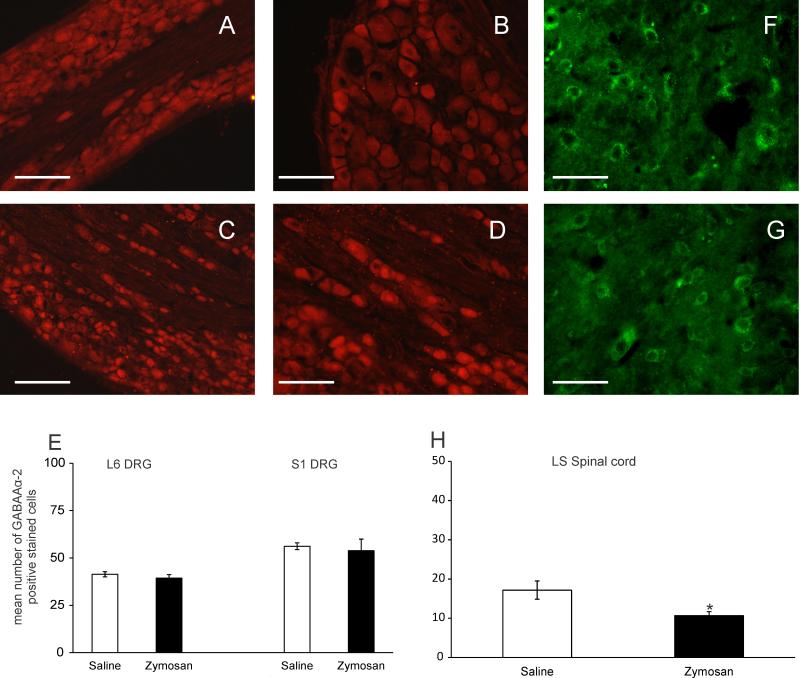
Fig. 11.
Photomicrograph of GABAAα-2 positive stained DRGs from the L6 and S1 DRG from neonatally saline- (A and B) and zymosan-treated rats (C-D). (E) Quantitative analysis of the number of GABAAα-2 immunoreactive cells from both L6 and S1 DRGs indicate that there was no significant difference between neonatally saline- and zymosan- treated rats. LS spinal cord from neonatally saline- (F) and zymosan-treated rats (G) showed a significant (n=6, p<0.05 vs saline) decrease in the number of GABAAα-2 positive stained cells (H). Scale bars represent 50μm. Values expressed as mean ± S.E.M of the number of GABAAα-2 positive cells from 6 animals in each group. p≤0.05 was considered significant. * compared with neonatally saline treated group.

