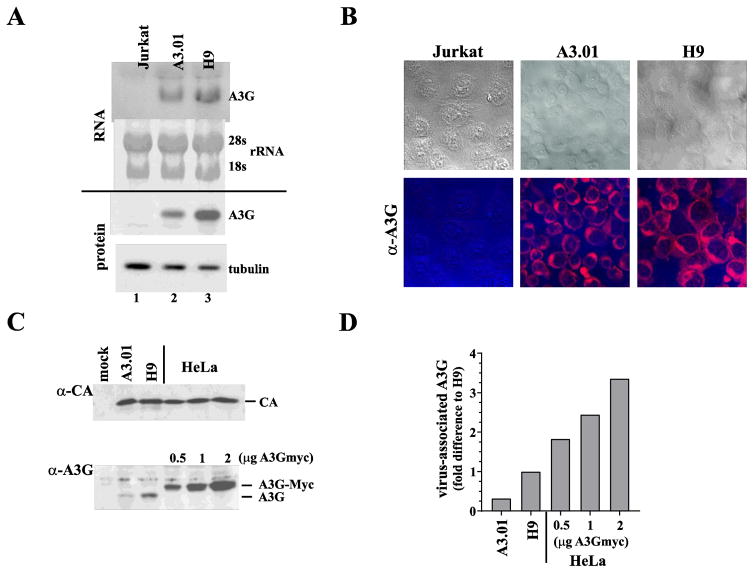
Fig. 2.
H9 and A3.01 cells have similar A3G characteristics. (A) Expression of endogenous A3G mRNA in Jurkat, A3.01, and H9 cells was determined by northern blot analysis (RNA). Twenty μg total RNA were loaded in each lane. To control for total RNA in the samples, ribosomal RNAs (28s and 18s) were visualized on the membrane by methylene blue staining before probing with a [32P]-labeled A3G-specific DNA probe. Results were quantified by phosphor-image analysis. A3G protein expression was determined by immunoblotting using an A3G-specific antibody (protein). To control for total protein in the samples, expression of α-tubulin was assessed by reprobing the A3G blot with a tubulin-specific monoclonal antibody. Protein gels were quantified by densitometry. (B) Expression of A3G in Jurkat, A3.01, and H9 cells as determined by immunocytochemistry. Cells were immobilized on glass slides by cytocentrifugation and fixed in methanol. Cells were stained with an antibody to A3G and visualized using a Texas Red-conjugated secondary antibody. Images were acquired by confocal microscopy (lower panels). Corresponding bright field images are shown at the top. (C) Comparison of virus-associated A3G. VSV G-pseudotyped stocks of NL4-3 Vif-null virus were used to infect A3.01 or H9 cells. Medium was replaced at 5 h and 12 h after infection and virus produced between 12 and 24 h post-infection was harvested, filtered, and concentrated by pelleting through a 4 ml cushion of 20% sucrose. Concentrated virus was quantified by reverse transcriptase assay and equal reverse transcriptase units were loaded on two 12.5% gels. Viruses produced from transfected HeLa cells in the presence of increasing amounts of A3Gmyc vector (0.5, 1, 2 μg) were analyzed in parallel. Proteins were transferred to PVDF membranes and probed with a capsid-specific monoclonal antibody (α-CA) or a polyclonal antibody to A3G (α-A3G). Proteins were visualized by ECL using HRP-conjugated second antibodies. (D) Signals from the immunoblots in panel C were quantified and relative amounts of A3G in the virus samples were determined by normalizing for equal CA signals. The A3G signal obtained from H9 derived virus was defined as 1. A3G signals for the other viruses were calculated as fold-difference relative to the H9 virus population.

