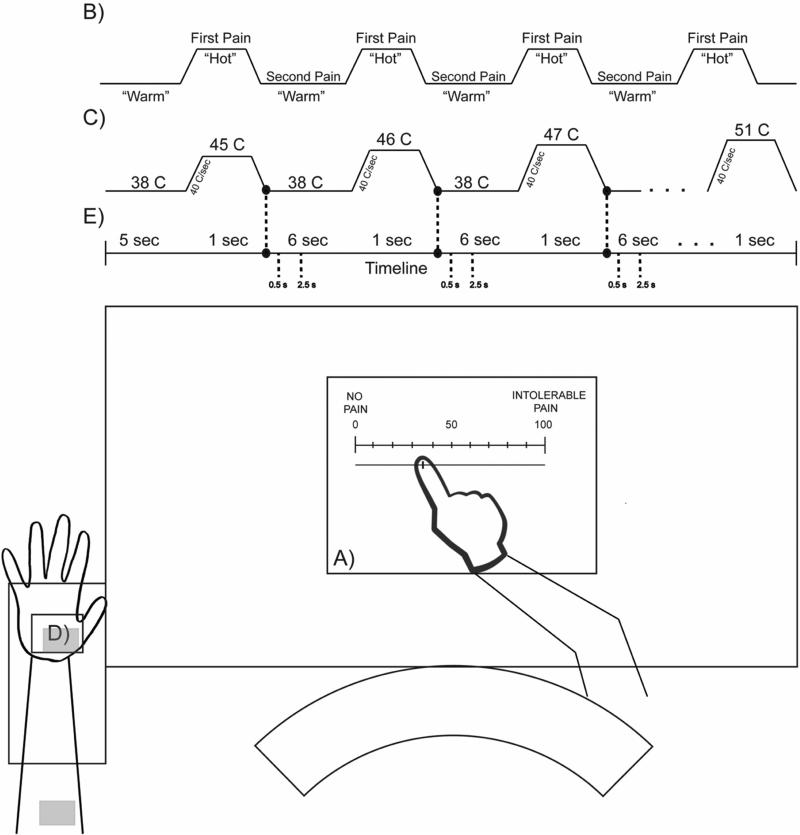
Figure 1.
Graphical representation of the experimental setup representing A) electronic score slider with 0 equal to “no pain”, 100 equal to “intolerable pain”, B) example of the visual aid presented to subjects during testing, C) stimulation profile, D) arm placement on thermode dependent on site tested, and E) timeline. This figure is an example only and not exact.

