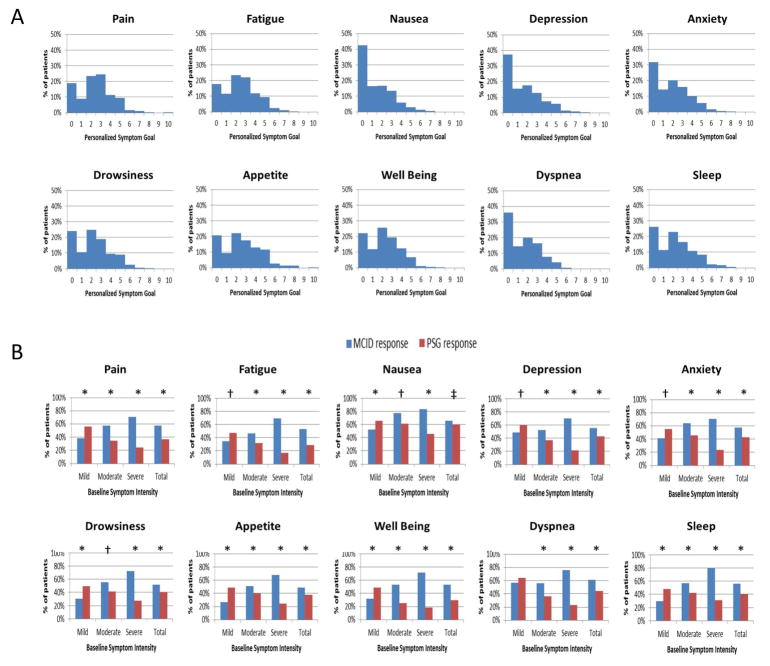
Figure 4. Symptom Response Criteria.
(A) Distribution of Personalized Symptom Goal for 10 Symptoms. A majority of patients reported a personalized symptom goal of 3 or less. (B) Response Rates Differences by Baseline Symptom Intensity and Response Criteria. We plotted the response rates by two criteria (minimal clinically important difference [MCID] and personalized symptom goal [PSG]) according to baseline symptom intensity (i.e. mild 1–3, moderate 4–6, and severe 7–10). Using the MCID criteria, patients with higher baseline symptom intensity were more likely to achieve a response and vice versa; in contrast, the personalized symptom response criteria resulted in the opposite conclusion. P-values were computed based on the McNemer test (* P<0.0001, † P<0.001, ‡ P<0.05). Reprinted with permissions from the American Cancer Society.(43)

