Figure 2.
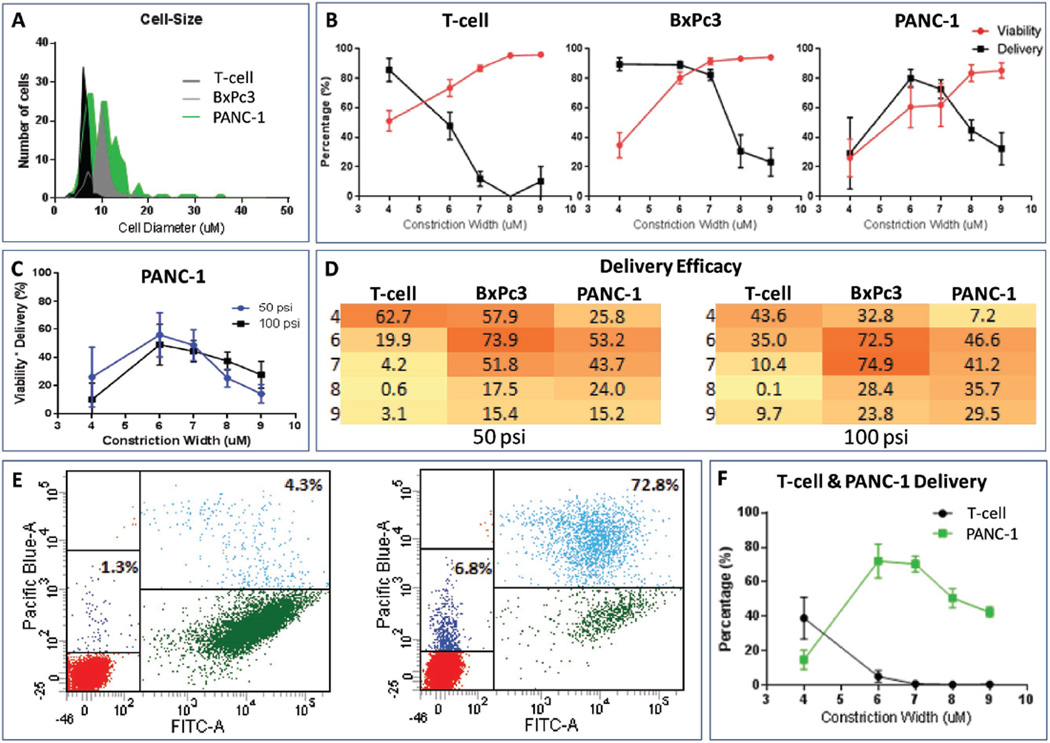
Cell size specific delivery. A) Diameters of the three different cell types (T-cells, BxPc3, PANC-1 cells). B) Percentage delivery and viability of T-cell (left), BxPc3 (center), and PANC-1 (right) when passed through chips with different constriction widths at 100 psi. The average and standard deviation of 3 to 5 independent experiments are shown. C) Delivery efficacy of PANC-1, where delivery efficacy is the product of percent viability and percent delivery at each condition (constriction width and pressure). D) Heat map of delivery efficacy when a suspension of one cell type (x-axis) is passed through chips with different constriction widths (y-axis) at 50 and 100 psi. Darker colors indicate higher delivery efficacy and lighter colors indicates lower delivery efficacy. E) Flow cytometry plot of a mixture of T-cells (low FITC region) and PANC-1 (high FITC region) cells incubated with the dextran blue dye (Pacific Blue), but not processed through the microfluidic delivery platform (left panel) demonstrating negative controls to establish the basal levels of surface receptor-mediated binding and nonspecific uptake of dye. Flow cytometry plot of a mixture of T-cell and PANC-1 cells passed through a chip with constrictions that were 6 µm wide (and 10 µm long) at 100 psi (right panel). F) Percentage delivery of a mixture of T-cell and GFP-labeled PANC-1 cells when passed through chips with different constriction widths at 100 psi. Each condition represents the average and standard deviation of three independent experiments.

