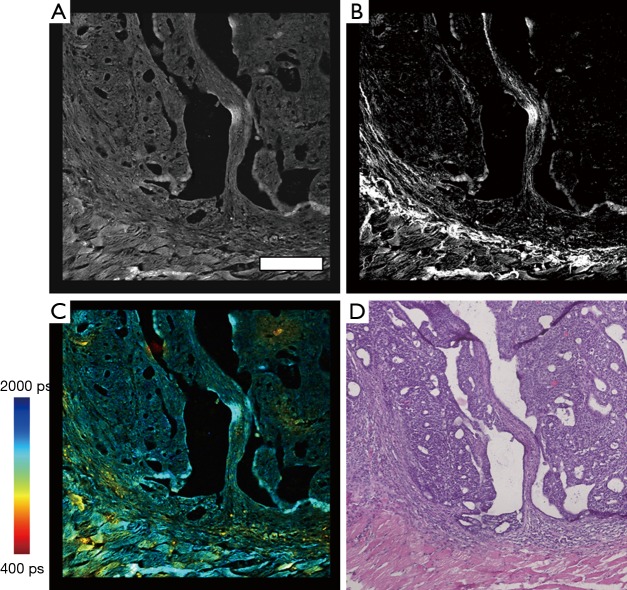
Figure 2.
Multimodal and histological data of a rat mammary tumor section. (A) TPEF intensity image; (B) SHG data of collagen networks and connective tissues; (C) FLIM of NADH metabolic activity; (D) H & E-stained histological section of the corresponding region of the rat mammary tumor. Scale bar in (A) is 200 µm and applies to all images (A-D). Color scale represents fluorescence lifetime in (C). TPEF, two-photon excitation fluorescence; FLIM, fluorescence lifetime imaging microscopy; NADH, nicotinamide adenine dinucleotide; SHG, second harmonic generation.

