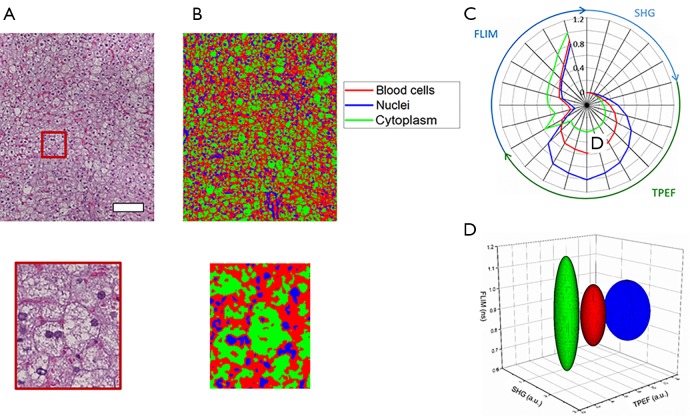
Figure 6.
Classification results of rat liver tissue demonstrating sub-cellular classification resolution. (A) Co-registered histology and zoomed region of interest; (B) classification map of corresponding regions. Red corresponds to classified red blood cells, blue corresponds to classified hepatocyte nuclei, and green corresponds to classified hepatocyte cytoplasm; (C) radial plot showing the mean multimodal signals of each class demonstrating the associated quantitative multimodal signatures; (D) simplified ellipse plot of the three classes [color legend in (C)] showing the characteristic statistical properties of the three classes according to the TPEF, SHG, and FLIM features. Scale bar is 100 µm. TPEF, two-photon excitation fluorescence; FLIM, fluorescence lifetime imaging microscopy; SHG, second harmonic generation.

