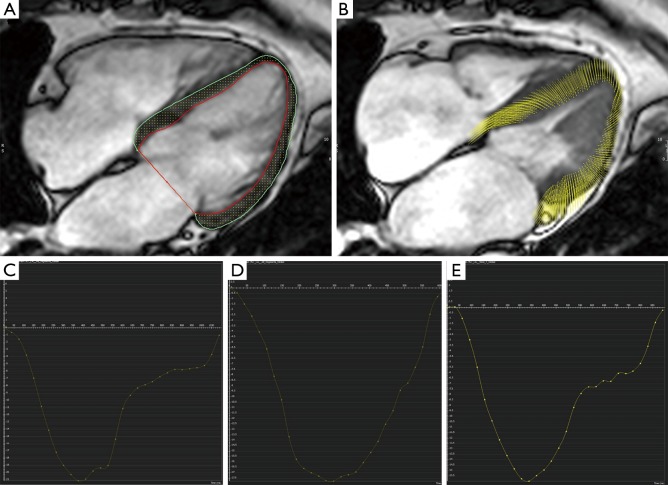
Figure 1.
Feature tracking analysis demonstrating measurement of peak longitudinal strain (PLS) derived from LV contours in diastole (A) tracked through to systole (B); generating strain curves in a healthy control (C, PLS =−21), a patient with “no / mild” symptoms (D, PLS =−18) and a patient with “significant” symptoms (E, PLS =−16).

