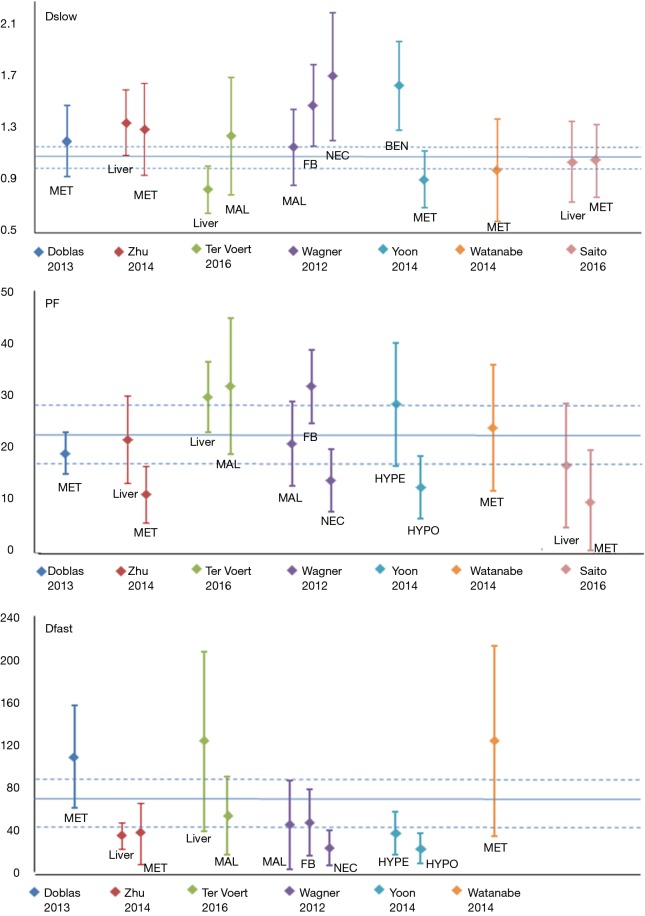
Figure 12.
Mean and standard deviation (SD) of Dslow (D, 10-3 mm2/s), perfusion fraction (PF, %), and Dfast (D*, 10-3 mm2/s) values in healthy liver parenchyma (liver) and metastasis (MET) and malignant nodules (MAL, pathology not specified), fibrous region (FB), necrotic region (NEC). Blue solid line represents median values of reported healthy liver intravoxel incoherent motion (IVIM) parameters. Regions between blue dash lines represent mid 50% data distribution (middle two quartiles) of reported healthy liver value. HYPE, hypervascular; HYPO, hypovascular.

