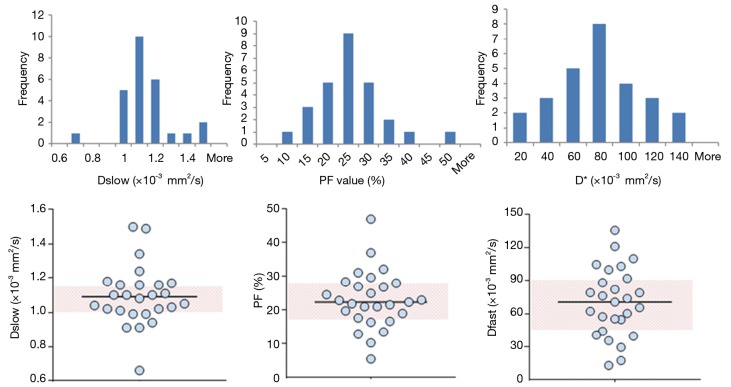
Figure 2.
Histogram and scatter plot show the median value and distribution of Dslow (D), perfusion fraction (PF), and Dfast (D*) of healthy liver parenchyma reported in 27 studies. Dslow, PF, Dfast have a median value of 1.09 ×10⁻³ mm2/s, 22.40%, 70.60×10⁻³ mm2/s respectively. Pink shadow in scatter plot indicates mid 50% data distribution of reported value (middle two quartiles).

