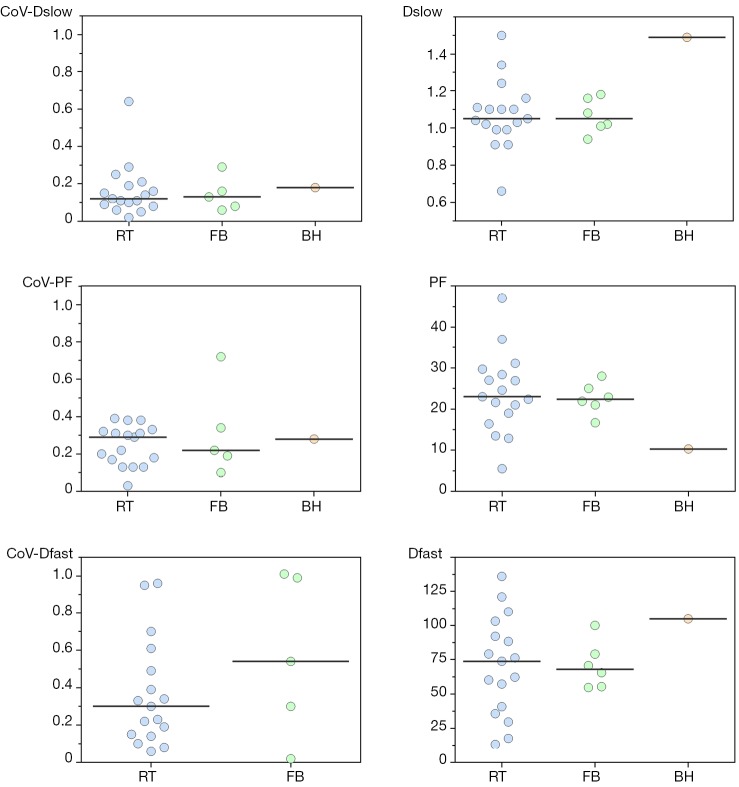
Figure 7.
Values and coefficient of variation (CoV) of Dslow (D), perfusion fraction (PF), and Dfast (D*) in healthy liver parenchyma with data acquired by respiratory triggering (RT) (9-11,15,23,24,42,43,45,46,48-51,53-55), free-breathing (FB) (19-21,40,41,47), and breath-hold (BH) (44). Solid line represents the median value of each group.

