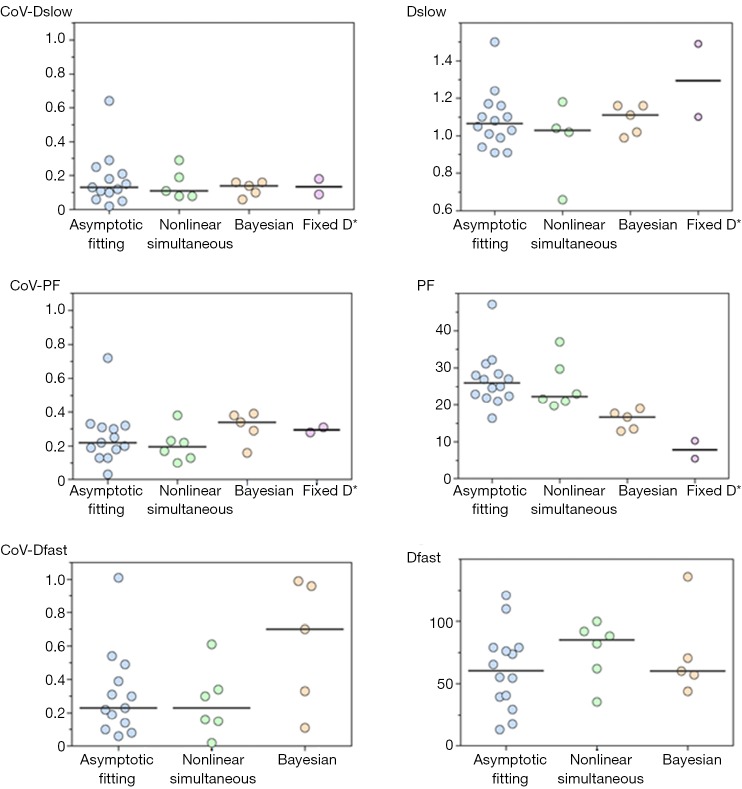
Figure 8.
Values and coefficient of variation (CoV) of Dslow (D), perfusion fraction (PF), and Dfast (D*) in healthy liver parenchyma with data acquired with asymptotic fitting (n=14), nonlinear simultaneous fitting (n=6), Bayesian fitting (n=5), and fixed Dfast fitting (n=2). Solid line represents the median value of each group.

